BTC/USD :HIDDEN BULLISH DIVERGENCE - OBV
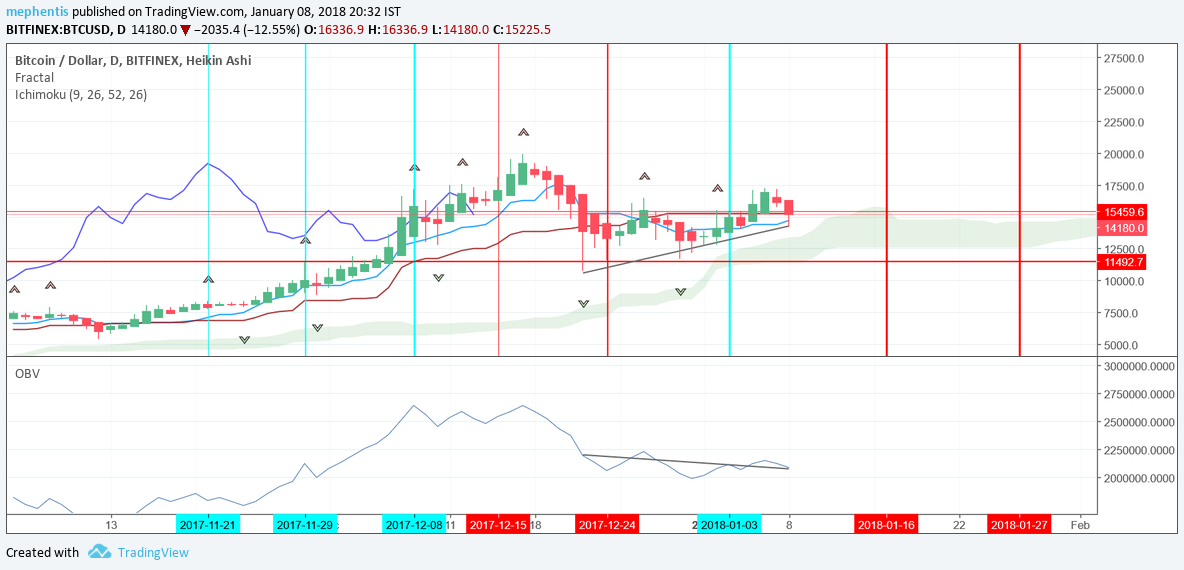
The price of BTC has retraced quite a bit today. Is it going to dip further, that's the question. Looking at the chart below, using the ichimoku and the OBV, I spot the price at a support level - being the kijun-sen and breaking out the OBV, it shows hidden bullish divergence as the price has made a higher low, while the oscillator shows a lower low. This indicates underlying strength and is a good sign to see during retracements.
Thank you for this enlightening post.
What is OBV ?? And how does it show that there is underlying strength for supporting the baseline?
Hey, OBV is on-balance volume indicator / oscillator. It's a technical indicator that draws a correlation between an asset's volume and it's price and is very helpful in understanding it's momentum. Basically what you look out for are divergences between the oscillator and the price action when the price is at a support or resistance level. The ichimoku tells us that the kijun sen (the red line) is a point of support/resistance and thus it's a good point to use the OBV. Check out this link, its got a cheat sheet to help you catch the divergence and parse it's meaning : https://www.babypips.com/learn/forex/divergence-cheat-sheet
I hope this helps. We'll know tomorrow if my OBV reading is right! fingers crossed!
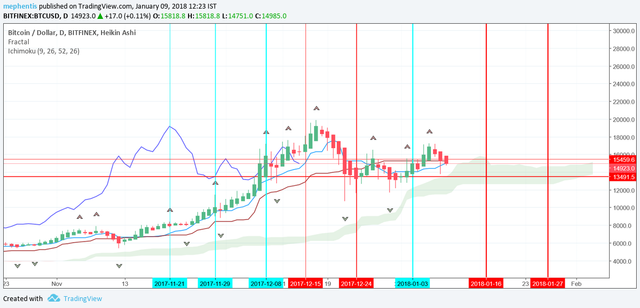
Well, so far there is a great support @ 14k for BTC it seems because it stopped dropping and is now coming back up.... Nows prob a good time to buy
I agree. I see support at 13491. See my chart below. And 16th of Jan (+/- 1 day) is going to be a day of change, so to speak, so pay attention close to that day.