Bitcoin price direction thoughts on the 1hr, 6hr, 1day and 3day time frames.
Hey Steemers, I hope you’ve had an awesome day on Steemit today! Bitcoin just took a nice pop throughout this afternoon / evening. This is likely what caused a lot of alts to correct, although many of them seemed to quite enjoy hitting the cloud support one last time.
Bitcoin rallied to around 2800 before commencing some uncertainty volatility upwards and downwards to bring us on a slight downtrend to correct the overbought notion on the 1hr stoch rsi indicator. We could be headed towards the cloud, maybe even to it for a close on the support.
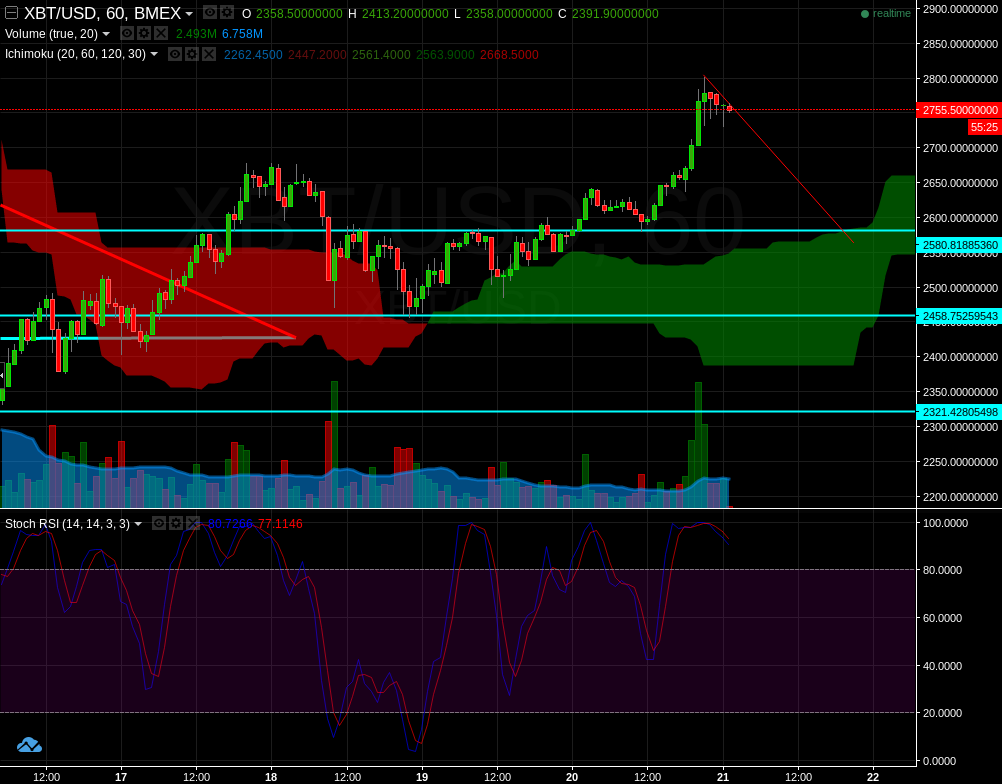
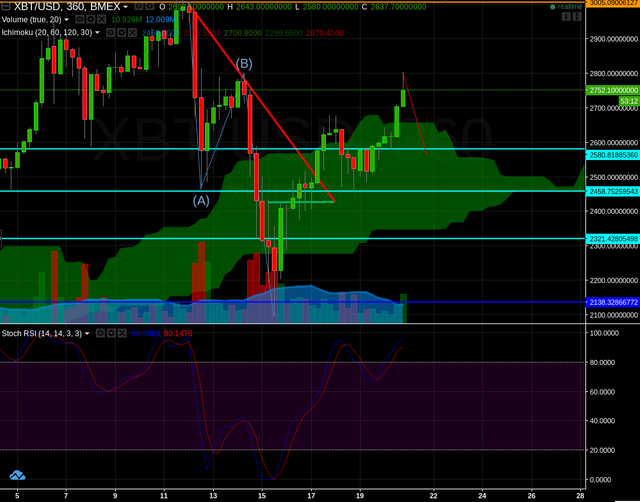
We can see this movement beginning to manifest itself, especially if we close this six hour with a high upstanding wick.
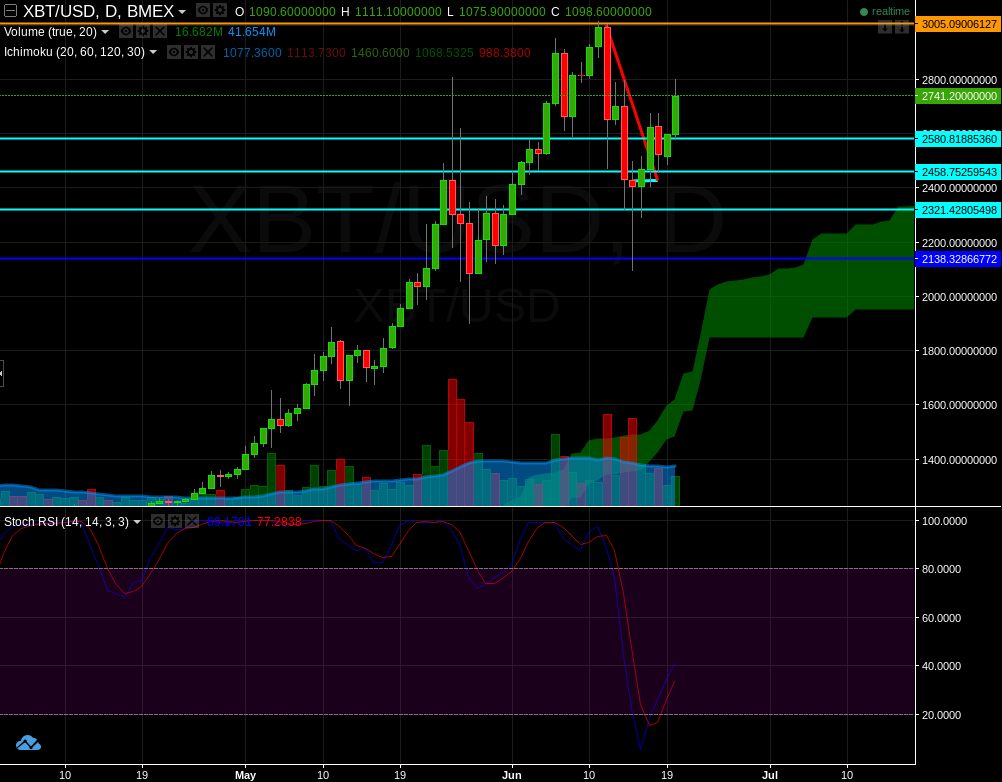
The daily stoch rsi is looking real strong right now with the potential to push up gradually and past 3000 over the next few days.
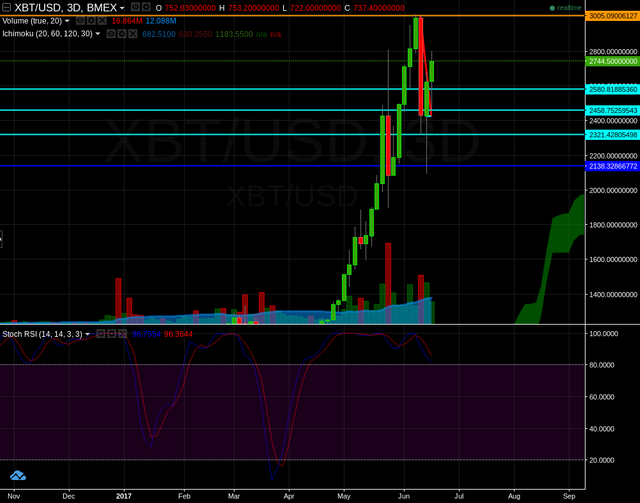
With the 3 day chart indicating that within a week we would then be re-testing 3000 to consolidate before our next impulse wave begins.
I hope my thoughts are a little helpful. Please don’t take this as financial advice, these are just my thoughts on where we are headed the next 6-9 days. You should always do your own technical analysis and have a trade plan. Please invest wisely and trade safely.
Peace, Love and Light.
Mark
I've heard from multiple sources that chart analysis is harder to use an indicator of future movement once you start getting as lower than two-day charts and 2 hour candles. Just a thought! I'm definitely not an expert.
You do have some good points on the subject! Which site do you use to generate those charts btw?
Thank you for stopping by :) It does get trickier but I use them in conjunction with each other to try and form a map of potential paths the graph can go, given the strength on the time frames. 1hr, 6hr, 1d and 3d just happen to be the time frames I find myself being able to produce to best trades to date. Mind you I have only been playing this game since January roughly... I use Coinigy to do my TA.
Of course! I haven't been into for very long either. Only about three months. One trend that I have found to be a fairly reliable indicator of where the price is about to head is the ways in which the MACD and the Signal Line crossover one another in the stochastic oscilator found at the bottom of most charts. I've learned that if the MACD crosses over the Signal Line in an upward fashion, 9 times out of 10 you will see a price increase.
It varies depending on the candle stick length, but it is even more helpful to compare them consecutively (if that makes sense) then you can see what is probably going to happen over the course of the larger time periods.
I usually stick to the basic charts provided by poloniex, but a couple months ago (when they still had their troll box) a few veterans suggested I try using a site that's a little more interactive and social:
https://www.tradingview.com/
You can share your charts and see what others are making and communicate with them as to how they go about creating their content! Pretty interesting stuff
I love how reliable some of these indicators can be on the correct time frames and coins. Its absolutely ridiculous but I love it. Comparing indicators consecutively is pretty imperative :) But over use can lead to a Picasso painting. I have never really used trading view, perhaps I'll give it a try some time.
One of my goals currently is to figure out a way to automate the comparison of these indicators and pair the combined quantitative analyses with trading API's in order to make a quality auto-trading application. Wouldn't that be sick?!
That would indeed be sick and I wouldn't mind the passive income but I love planning a trade and then executing it!
What a pretty forecast! I'm really hoping for one more dip before the jump to $3k so I can buy!
Ha thank you :) I was thinking about a three wave down set up before it ramped up again but I can't complain about it going up. There should be a few buy opportunities though. Look for tests of the cloud.
Sweet. Do you have a financial background? I'm not gonna think any less of you either way because posts like this are really helpful to me, I'm just curious I'm a mechanical engineer, so this is all just a bunch of fairy dust I'm trying to make sense of.
Nope I'm not at all a financial advisor, although I enjoy finance and learning about the markets... I'm an artist at heart that fell down the rabbit hole of cryptocurrency a while back. Suddenly I find myself with 'too much' information to take in and too little time :')
Dude. I totally feel that. I'm on vacation with a group, and a couple days ago, a guy that I met introduced me to steemit and gave me some good insight to the cryptocurrency world. Haha now I'm hooked. It really is a rabbit hole
Wow thats an awesome way to come across this space! I've loved my time on steemit from the moment I started using it :)