Ethereum Price Technical Analysis – Double Bottom Formation?

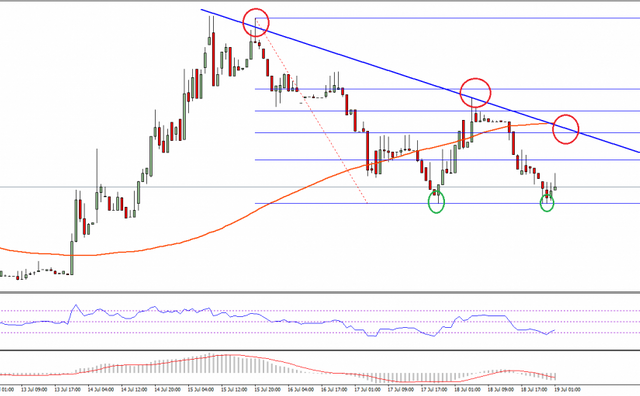
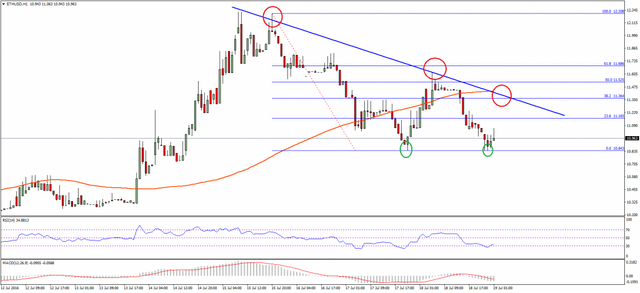
Ethereum price ETH climbed higher yesterday and broke the 100 hourly simple moving average to trade as high as $11.61. It found sellers and started to move down. It is important to note that the recent failure was around the 50% Fib retracement level of the last drop from the $12.20 high to $10.85 low. So, we can say it was a crucial failure, as the price failed to break a major technical level.
There is also a bearish trend line formed on the hourly chart (data feed via Kraken) of ETH/USD, which acted as a resistance and prevented the upside move. The price during the downside move settled below the 100 hourly simple moving average, which is a bearish sign.

However, there is a positive sign on the hourly chart, as there is likely a double bottom pattern forming, which can ignite a rally in the short term. An initial resistance is around the 23.6% Fib retracement level of the last drop from the $12.20 high to $10.85 low. On the downside, the most important support area is at $10.80.
Hourly MACD – The MACD is in the bearish zone, and showing no sign of a recovery.
Hourly RSI – The RSI is around the oversold readings, which may ignite a minor correction in ETH.
Major Support Level – $10.80
Major Resistance Level – $11.16
Charts courtesy – SimpleFX
hahaha, fun :) Nice gif :D
Good post. Nice to see I'm not the only one who thinks like this. The current total market cap of all cryptos might seem high but blockchain is here to stay and will involve all our lives. I do see a bright future for everyone that's hold's their coins with a long term vision. Personally I always use: https://www.coincheckup.com Since I use this site I make so much less basic investment mistakes. Check for example: https://www.coincheckup.com/coins/Ethereum#analysis For a complete Ethereum Analysis