Possible Bitcoin trends Long and short term -Analysis 1 ( 25/05/2018 ) ( English and Spanish ).
English
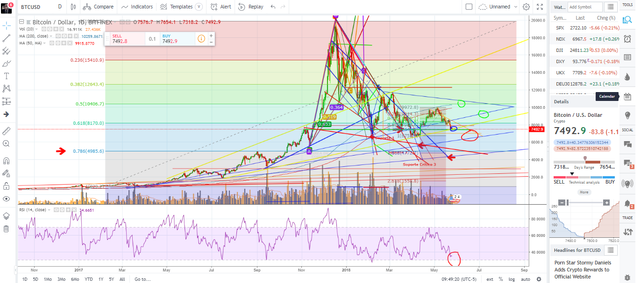
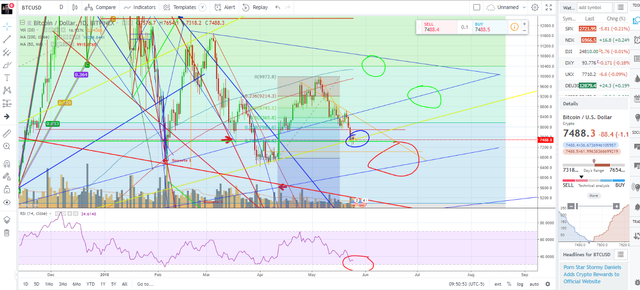
I have 2 analyzes, one annual and the other in the short term, in the annual it is below the 0.61 Fib, and in short just in the 0.78 Fib, which are the patterns that it has played in retracements, since it started the year 2017 it has formed a bullish channel (yellow lines) and is right in that support, where there is a probable setback, otherwise, if it breaks, it means that it has broken that channel and enters a critical support that if it exceeds 7,000 USD we would be seeing it in a range from 6,300 to 7,000, bouncing to 9,000 USD in the short term. In the long term, if the fall continues, then it would touch the 0.78 Fibonacci, if it exceeds the support between 6,000 and 6,300 USD, it will be launched to the next stage of the 4,900 to 5,600 USD. It is important to mention that, in the long term, high (R) and low (S), increasingly low and increasingly high lows have been increasingly reduced, which means that an upcoming change event trend, hence the story continues .. do not stop following me :)
Annual chart, daily candles. / Gráfico anual, velas diarias.
Short-term chart, daily candles. / Gráfico a corto plazo, Velas diarias.
Español:
Tengo 2 análisis, uno anual y otro a corto plazo, en el anual está por debajo del 0.61 Fib, y en corto justo en el 0.78 Fib, que son los patrones que ha tocado en retrocesos, desde que inició el año 2017 ha formado un canal alcista (lineas amarillas) y está justo en ese soporte, donde existe un probable retroceso, de lo contrario, si lo rompe, significa que ha roto ese canal y entrá a un soporte crítico que si rebasa los 7,000 USD lo estaríamos viendo en un rango de 6,300 a 7,000, rebotando a los 9,000 USD en corto plazo. A largo plazo, si continúa la caída, entonces tocaría el 0.78 Fibonacci, si rebasa el soporte entre 6,000 y 6,300 USD se lanza a la siguiente etapa de los 4,900 a 5,600 USD. Es importante mencionar que, a largo plazo se han ido reduciendo cada vez más los altos (R) y bajos (S), los altos cada vez más bajos y los bajos cada vez más altos, lo que significa que un próximo evento de cambio de tendencia, de ahí la historia continúa.. no dejen de seguirme :)