Bitcoin: Technical Analysis
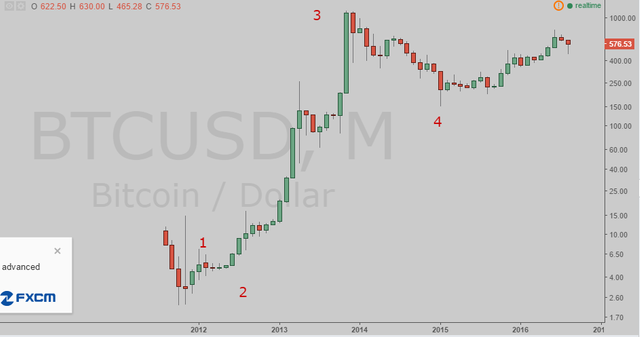
Based on the Elliott Wave Principle, markets move in five waves up followed by three waves down. In this article, I will apply this principle to Bitcoin. I will start with the monthly charts.

I believe the wave one finished in January 2012, and the wave two ended in April 2012. The wave three started in April 2012, and ended in November 2013. After that, the wave four started in November 2013, and ended in January 2015. We are currently in the wave five. I am expecting this wave five to make new all time highs during the next 18 months.

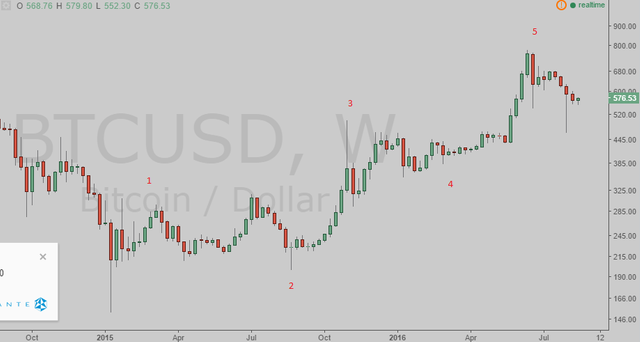
In the weekly chart, we have finished five waves in lower degrees. The wave one started in January 2015, and ended in March 2015. After that, we saw the wave two ending in August 2015. The wave three started in August 2015, and ended in November 2015. After that, we saw wave four ending in February 2016. The wave five started in February 2016, and ended in June.

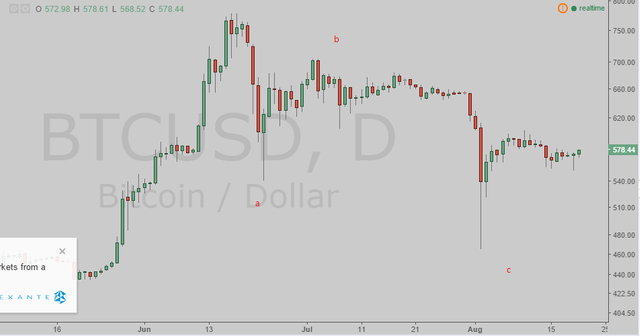
In the daily chart, we can see the latest correction. The wave a started on June 17, and ended on June 23. After that, the wave b corrected into July 2. The wave c started on July 2, and ended on August 2. I believe we have already started the next impulsive leg higher, which should make a new all time high in price during the next 18 months.
Disclosure: I am/we are long BTCUSD.