Bitcoin (BTC/USD): HAMMER TIME!
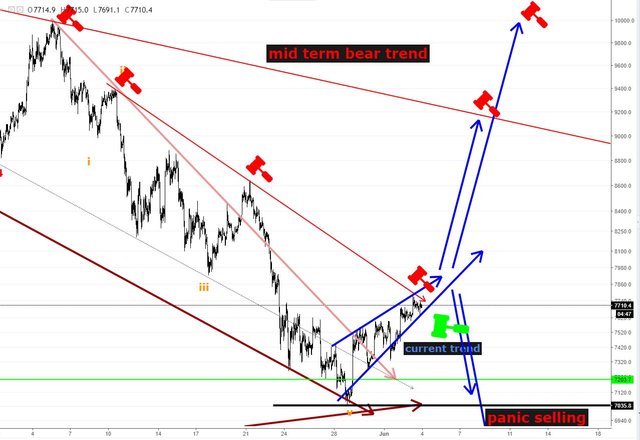
Let's play a game: where will be the next red hammer?
Let's analyze Bitcoin
The end of a correction ends with a C wave which is made of 5 waves (i-v)
After a C wave ends, a new cycle in the opposite direction is likely to take place. Usually wave i of the next cycle is headed to wave iv of the prior trend.
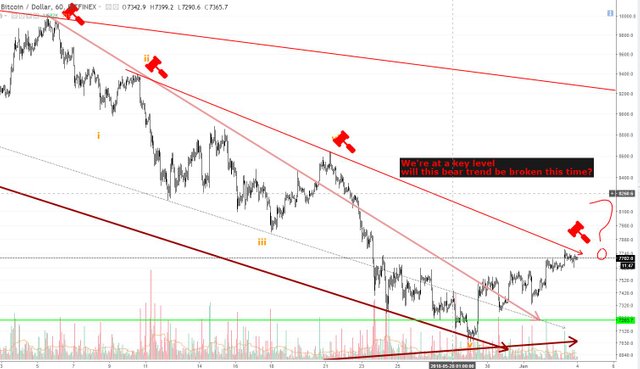
Let's see how Bitcoin is playing with the bear hammers
Even though BTC/USD has broken several bear trends is still facing a key resistance.
If certainly Bitcoin has changed the trend, this time this resistance needs to ve violated

Violated!
Let's end up this post with the bigger picture Bitcoin/USD
This could be a bear pennant or a bullish pennant. Breakout and volume will determine the next move. Current short term trend is bullish since there are higher lows.


Great analysis, I see nothing stopping price from getting back to the $8500, but price will need good news/volume.
Good quality comment!
I think there is only one bear trend left before bitcoin starts the next bull run!
Agree that around 10k there is major supply. However, if 10k is broken, most shorts will run for cover and will push the price quite high (IMHO to around 11.5k)
Another great post with excellent comments. I'm learning. I was always confused how the trends lines are drawn because they change often. In today's post, I finally see that it's ok to have multiple trend lines. For instance, the first two red hammers had a trend line, but the third red hammer started a new trend that is still being confirmed with the 4th red hammer.
Trend lines are drawn by connecting the higher lows (bulltrend) or the lower highs (beartrend)
They are tricky because there are "trends inside trends" the same way as there are waves inside the waves.
A good approach is to check out higher time frames like daily or 4hr charts and draw a trend as it were the Security Market Line (regression line of the overall price trend) without taking too much into account if the trend has been violated or not.
Also, you can plug a 200 EMA (or even shorter as a 50 period EMA) and use it as a trend indicator.