How to Trade Bitcoin in 2018
Last year was a stellar one for Bitcoin, as it opened trading at $966 before embarking on a rally that took it to as high as $20,000. Even after the volatility of the past few days, Bitcoin has beaten all the other asset classes by a huge margin.
The big question on everyone’s mind now is: what will happen in 2018 and how should one trade Bitcoin?
The experts are divided in their opinion. The aggressive bulls have given targets of above $60,000 for 2018. That’s a 300% increase from the current levels. On the other hand, the skeptics continue to question the cryptocurrencies’ valuation, calling it a bubble.
Some expect wild swings in 2018. Saxo Bank’s outrageous prediction lists a possible high of $60,000, followed by a drop to $1,000. Similarly, cryptocurrency entrepreneur Julian Hosp believes that Bitcoin will fall to $5,000, but he tends to think that it will also touch $60,000. He is not sure which level will be reached first.
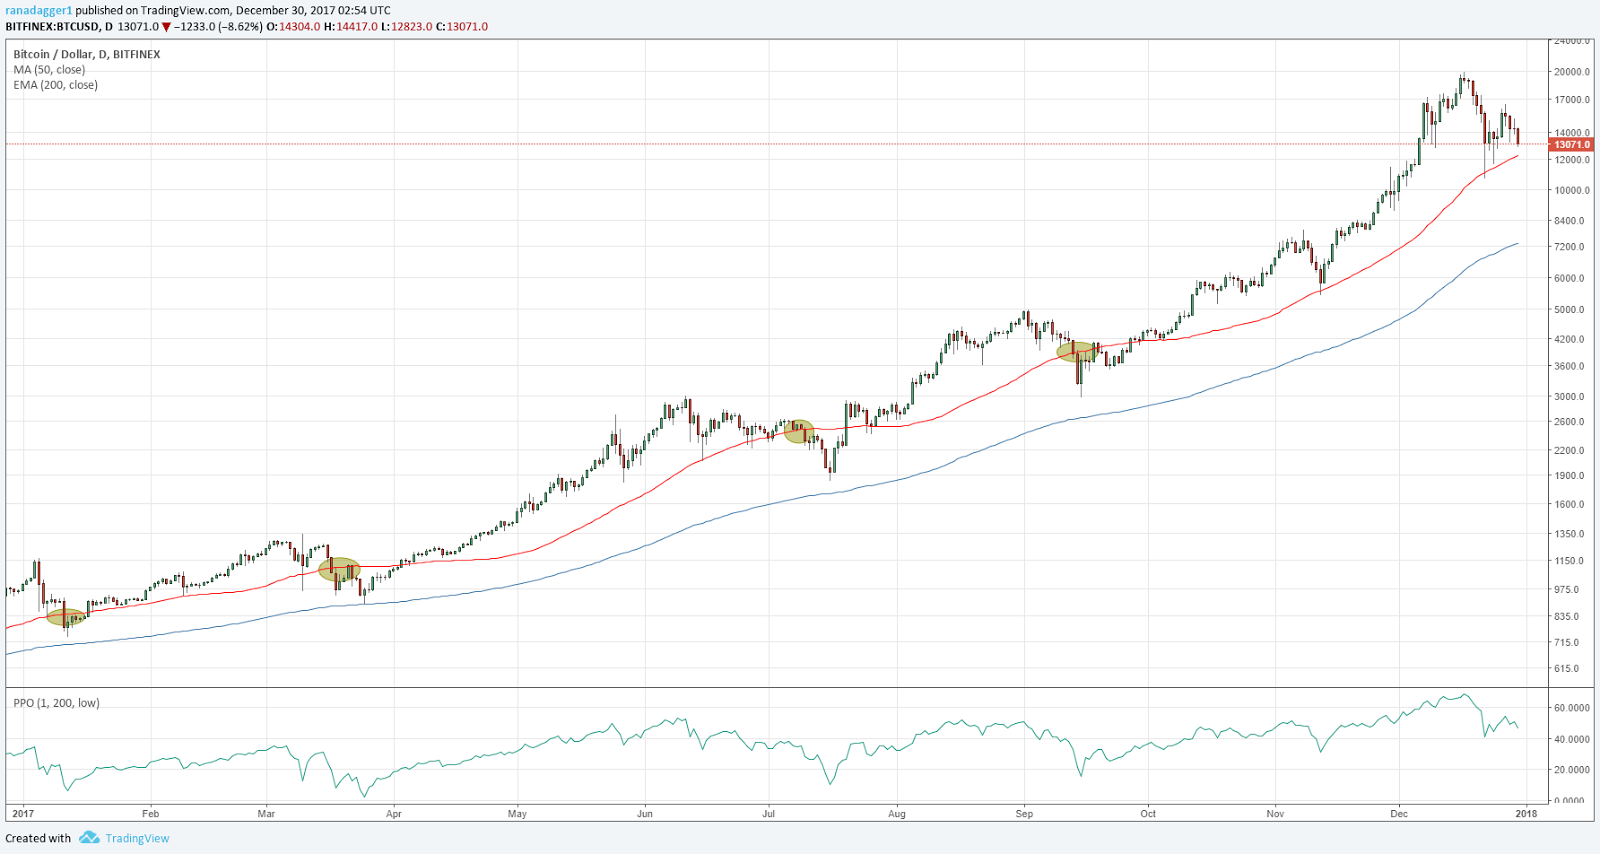
While the predictions offer us different opinions, it is difficult to trade off them. So we have tried to identify a few unique patterns on the charts that repeated in 2017. These can be used as guidelines by the traders to develop a suitable strategy for 2018.