Bitcoin could visit 3600 in coming days
BTC/USD
Bitcoin is really under pressure since Feb 2018 and the month by month chart has made several lower highs and lower lows which confirms the bearish trend of Bitcoin. one thing a trader must understand that the last leg of a bear trend or bull trend happens to be impulsive and the price moves aggressively and keeping that in mind and considering this leg as the last leg, I do feel that Bitcoin could visit 5500 followed by 3600 level in coming months (within 2018). Also I must say that the price will remain at 5500 or 3600 for very short period of time, if it tests those level and we can see a massive short covering rally thereafter.
Now let's have a look on the Hourly, daily and Weekly chart of BTC/USD.

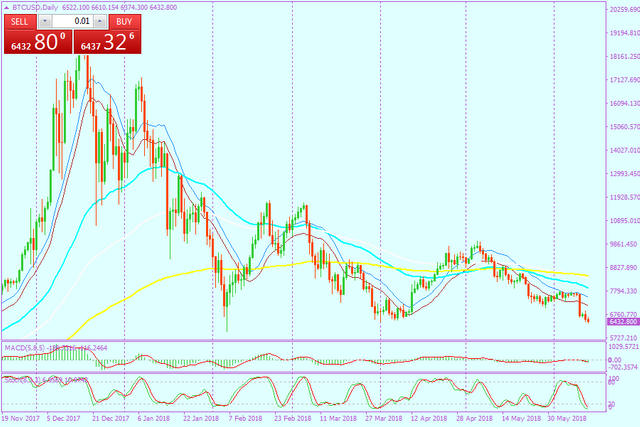
The chart clearly shows lower highs and lower lows confirming a strong bear trend in Bitcoin. From the 55,100 and 200 moving averages also, a bear trend is being confirmed as the price is firmly trading below these moving averages.
Supports & Resistances
R3 - 7256
R2 - 7075
R1 - 6798
Pivot - 6618
S1 - 6300
S2 - 6096
S3 - 5824

So all the indicators are pointing to a bearish bias for Bitcoin and unless it trades above 8100, the Daily chart is not going to change it trend and as long as the pair is trading below 7200, one can benefit from the bear trend of Bitcoin.

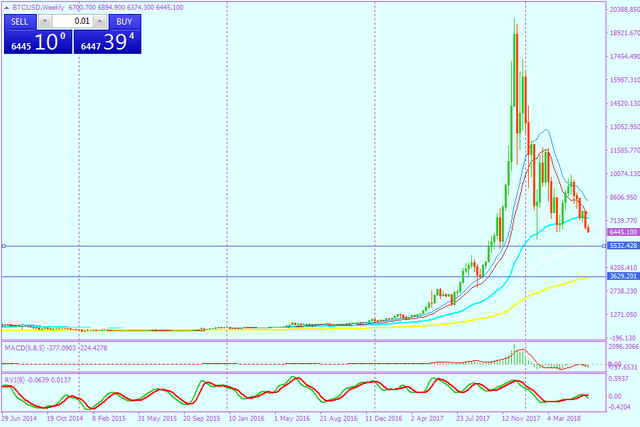
From the weekly chart the trend is looking ever more clearer and seems like going all way to 5500 level which is the confluence zone of 100 moving average and if 5500 get breached then the path is all way set for a test of 3600 level which is the confluence zone of 200 moving average.
3600 is a multi year support zone and hence could spark significant short covering rally should the price visit that level. If 5500 level finds support then also we can see some good rally towards 9000 zone again.
Legal Discliamer
This is not an investment advice and this is purely an technical analysis and one should not take it for granted as an investment advice and one should invest that much which he can afford to loose.
3600 level will really be a lot of pain and if this happens then altcoins will bleed like anything and we may see steem below 0.8 usd if that happens. fingers crossed. Let's see.
Very nicely written article.
Thank you and Have a great day.
Weekly chart is saying that 3600 is very very likely and the large time frame does not tell a lie. Apart from that bitcoin volume is also fading, so when such a condition appears in a bear trend then the nearest support becomes very very apparent. Thank you for commenting in my blog.
You got a 18.27% upvote from @emperorofnaps courtesy of @littymumma!
Want to promote your posts too? Send 0.05+ SBD or STEEM to @emperorofnaps to receive a share of a full upvote every 2.4 hours...Then go relax and take a nap!