What does BitCoin Chart Tells US ! Investing Advice for 2017-2020
This chart is analyzed by me and everything you see here is technical Analysis, so nothing else should be consider when investing on it.
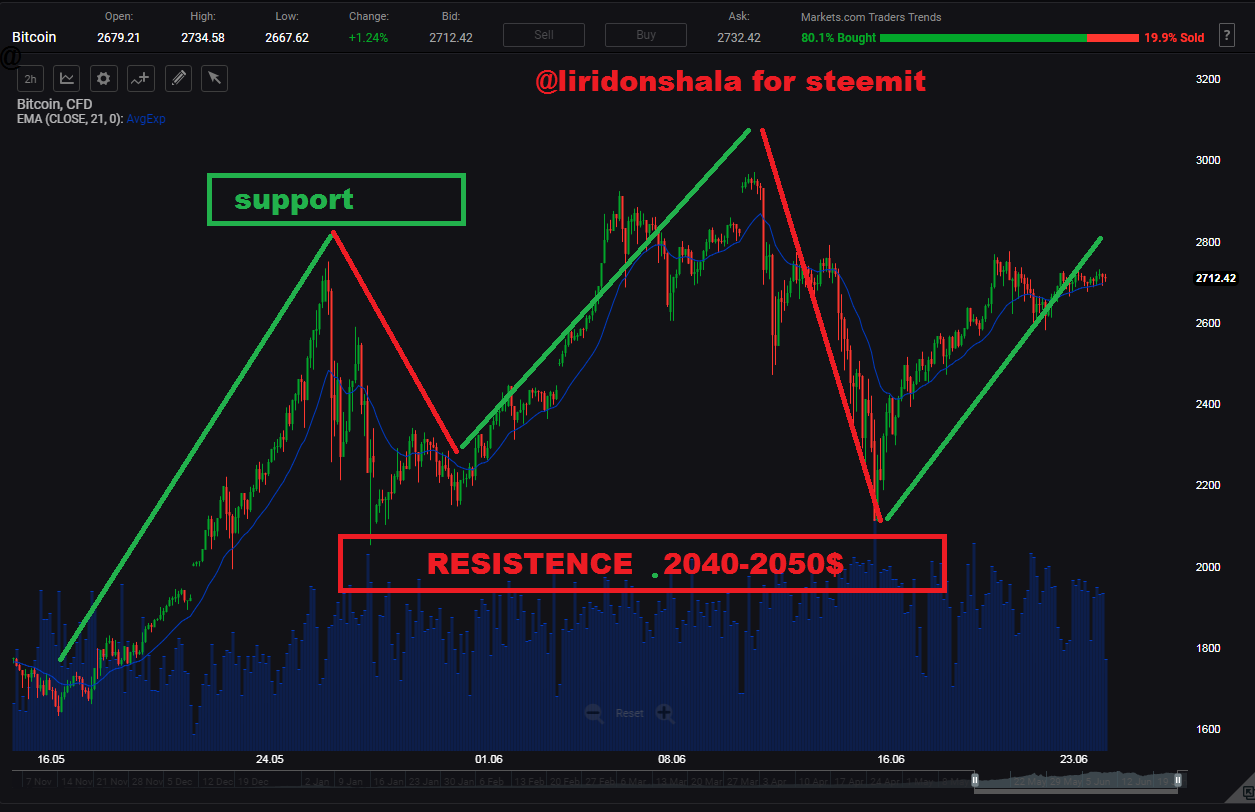
This chart represent a long term perspective which tells us two things :
LONG TERM INVESTORS - should see some consolidation of the market at 2700-2800$ , they may see a pullback levels down to 2472-2314, but the entire perspective is up.
SHORTY TERM SPECULATORS- 
This chart is telling us little consolidation pattern at the levels of 2735-2700 usd with the tendency and potential to go lower at the levels of 2630-2600 usd. This pattern showed on the chart tells us the legs and the strength of the momentum is weak which may lead to further downside of the trend.
Overall - Long term investors who's big goal is buying and holding may be consider low price to get in, but for those speculative who are interested for few dollars increases on the price of bitcoin, this is not going to happen, the more you see the chart the better you can tell the direction of the markets.
If there would be no other big events or news that may fluctuate bitcoin then the price of it may be seen decreasing on the next week down to 2600 or even further down at 2500 usd.