Bitcoin Price Continues Medium-Term Decline
Bitcoin price slipped over the edge during weekend trade. Analysis looks at the basic chart indications and potential decline targets.
Bitcoin Price Analysis
Bitstamp 4-Hour Candle Chart
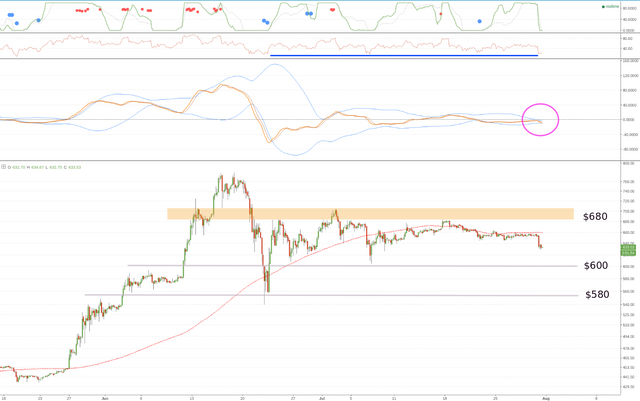
The 4-hour Bistamp chart shows that the market had sold price straight through $640 support, from where price has been slowly selling-off toward $600 and 4000 CNY.
Although 4hr MACD had signaled Sunday morning’s decline (magenta circle), the stochastics (top panel) are grouping at their minimum, while RSI has achieved a previous lower low (horizontal blue annotation). The stochastic and RSI indications imply that price may need to correct upwards once decline to $600 has been achieved.
The present decline happens below a bearish 1-day chart (MACD declining below its signal line), as well as a bearish 3-day chart where both MACD and the stochastics declining. Hence, we may have to wait a week or two for the decline to bottom out and find support.
Based on the 1-day and 3-day bearish charts, the eventual destination of this decline looks to be at least $580, near the previous corrective low. Some analysts are calling for decline to “structural support” (meaning the previous harmonic pivot) at $450 and, from a technical perspective, nothing precludes this from happening.
Fortunately, we don’t have to guess the bottom. Once we see the 4-hour MACD establish above its zero line and then advance above its signal line – with price above its 200MA, as in the extreme left of the chart – that will be the signal to look for an entry into the next wave of advance. Advance will once again have to grapple with the all-important $680 resistance level.
Summary
Bitcoin price remains in a medium-term correction and may be unfolding the final decline to support prior to, and hopefully, a bounce-and-surge rally. Downside targets are at $600 and $580. It is preferable that the market find support at $580 quickly, and without declining lower, since this could draw the 1-week candle chart into bearish bias. Better to get tests of structural support over and done with.
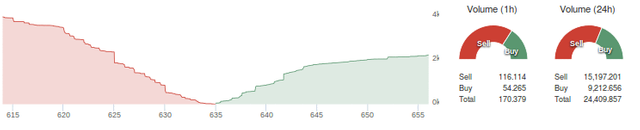
Bitfinex Depth Chart and Buy/Sell Volume
Disclaimer
The writer trades Bitcoin. Trade and Investment is risky. CCN.LA accepts no liability for losses incurred as a result of anything written in this Bitcoin price analysis report.
Nice work
Keep up the great work @levis
Upvoted