Forecasting Bitcoin/Altcoins With Live Charts
Methods of forecasting:
- Price action: visually studying the charts and indicators and learning how they correlate to price movements
- mean reversion: looking at when something is overbought/sold relative to the mean and assuming it will correct.
- Using future markets to predict where the price of the underlying asset will go.
- BitBank!
https://BitBank.nz uses input features like orderbook imbalance, slopes in the trades, weighted averages in the trades over time, spread and then gives the input features to a Machine Learning algorithm to train various weightings/features and come up with a forecast.
In the main altcoin forecasts page you can see across all the 70+ market pairs, some features in the market (spread, orderbook imbalance, change in weighted averages in the trades vs current orderbook midpoint, best fit slopes in the trades over time) and what our predictions are given these features in the market, and given what our forecasts are, what an automated trading bot may be placing orders of buying/selling at in those markets.
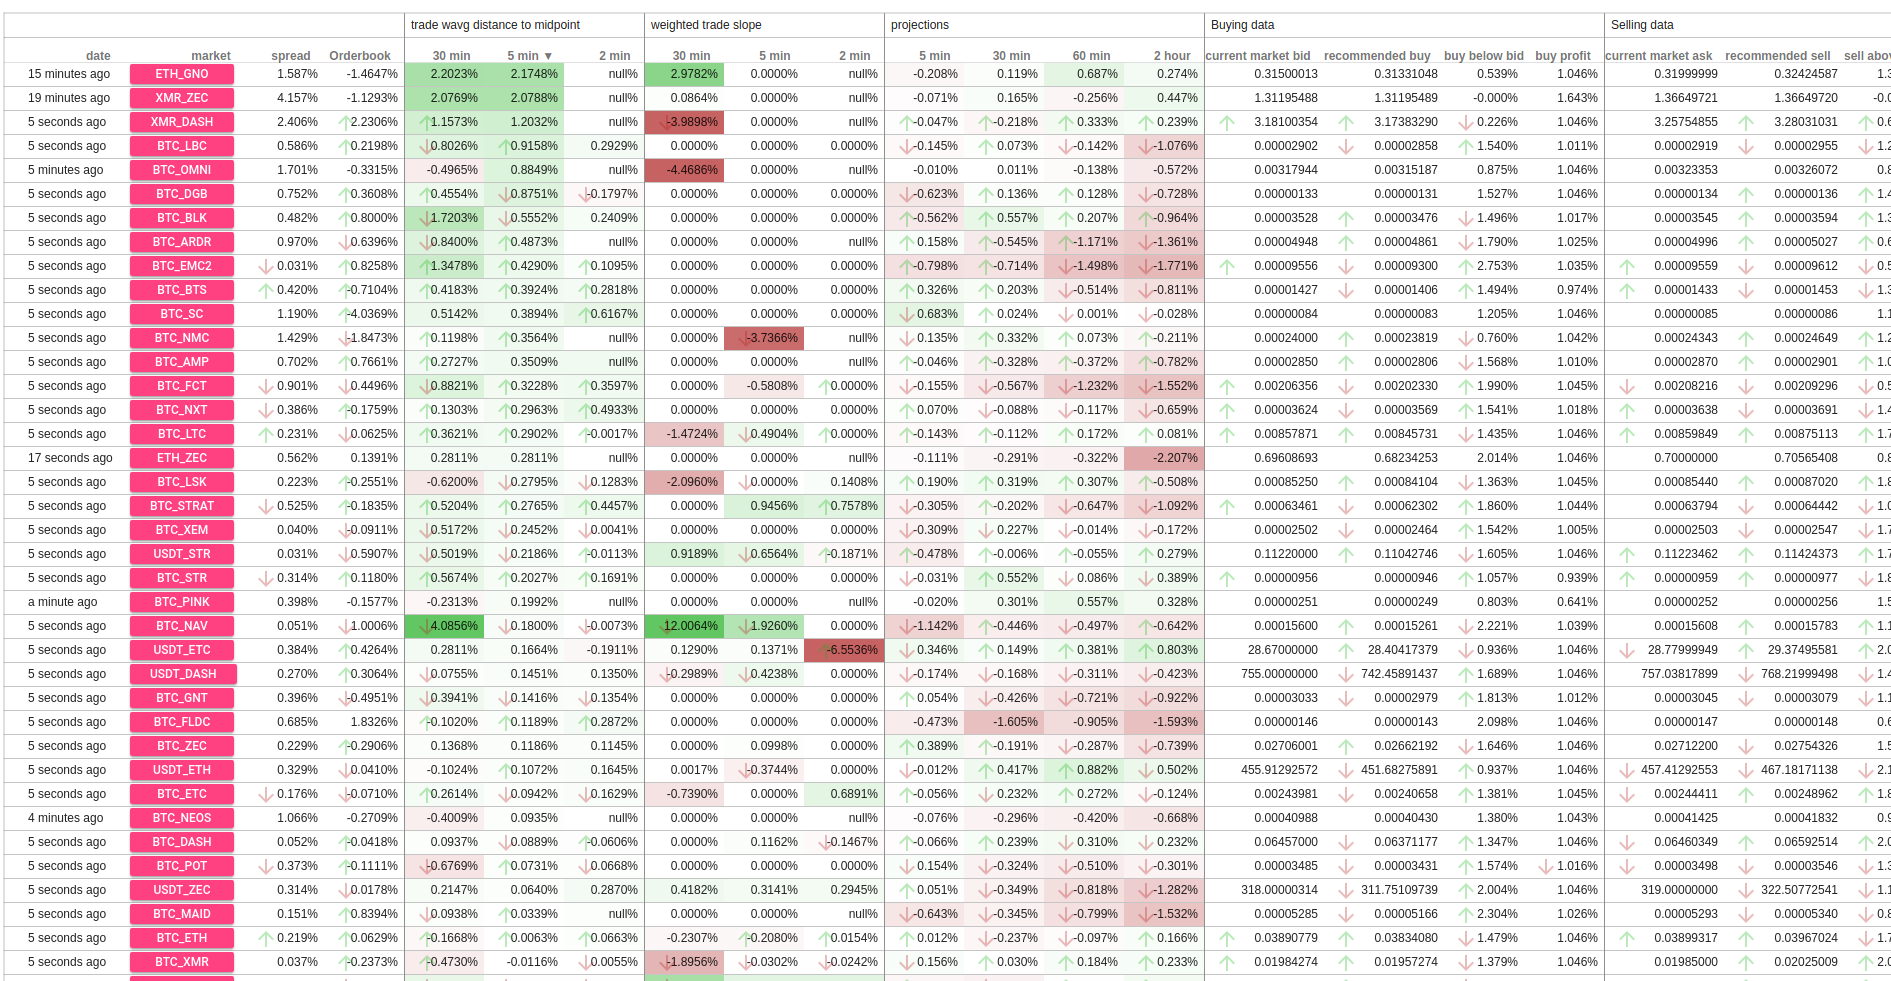
Market Features/Indicators
Spread seems fairly unrelated to price movements its just related to how much money you can make if your trading by both buying and selling that same currency pair.
Orderbook imbalance is defined as the weighted average in the current orderbook - current midpoint between best ask/bid, if positive there are more buys closer to the best buy and sells are farther away from the best sell. This sometimes moves with price.
Trade wavg distance to midpoints can be useful in showing how the price movement is changing over time, for example as the price first peaks and levels off youll see the 30 minute weighted trade average head up as the price spikes and back down to 0 as the price movement levels off, often its smoothed and moves less for longer time periods like 2 or 5 minutes move more than 30 minutes, if its headed for negative values this can mean the markets are turning downward.
Trade slopes can help show the direction of the best fit line through the trades weighted by trade amount, similar to trade wage distance to midpoint it helps you search for coins that have recently gone up/down in the recent 2 min 5min or 30 minutes.
The BitBank Predictions are forecasting the weighted trade average over a time bucket and so don't currently show the volatility just where a future trade may land on average.
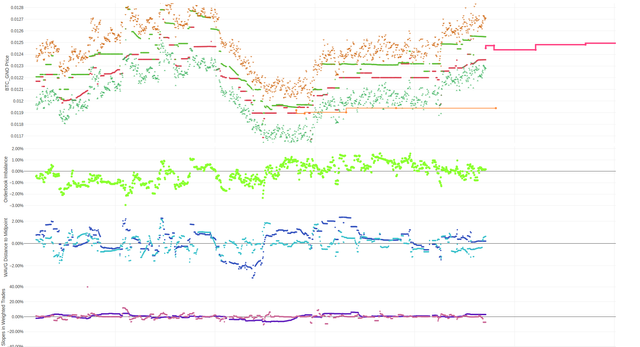
You can click in on a market pair and see a more detailed Live Bitcoin Charts over time to help you interpret the data a bit more e.g. Checkout the botcoin/gnosis market https://bitbank.nz/coin/btc_gno
Making money!
These live bitcoin charts are pulling data from poloniex but the trends from a liquid market like USDT/BTC can be extrapolated to different exchanges. That is you can reuse the trends and price movement forecasts from https://BitBank.nz on any exchange e.g. Bitfinex, Kraken, GDAX. You can even trade futures on a platform like Bitmex, although the future markets move quickly they respond to the underlying changes in the base asset and often oscillate around the base price that you'll have the upper hand predicting.
You can use something like mean reversion knowing a more detailed picture of the underlying asset price of bitcoin and detecting when there are sharp moves away from the correct future price in the futures market, that's where the sweet spot is for trading and with all the volatility in the cryptocurrency space there's more than enough to make some decent gains :)
Pricing Starts at .03 BTC for 3 months with up to 25% off for 1 year
Also checkout our referral program to earn .003 BTC every paying user!
Happy Trading Everyone!
:)