BTS/BTC CHART ANALYSIS
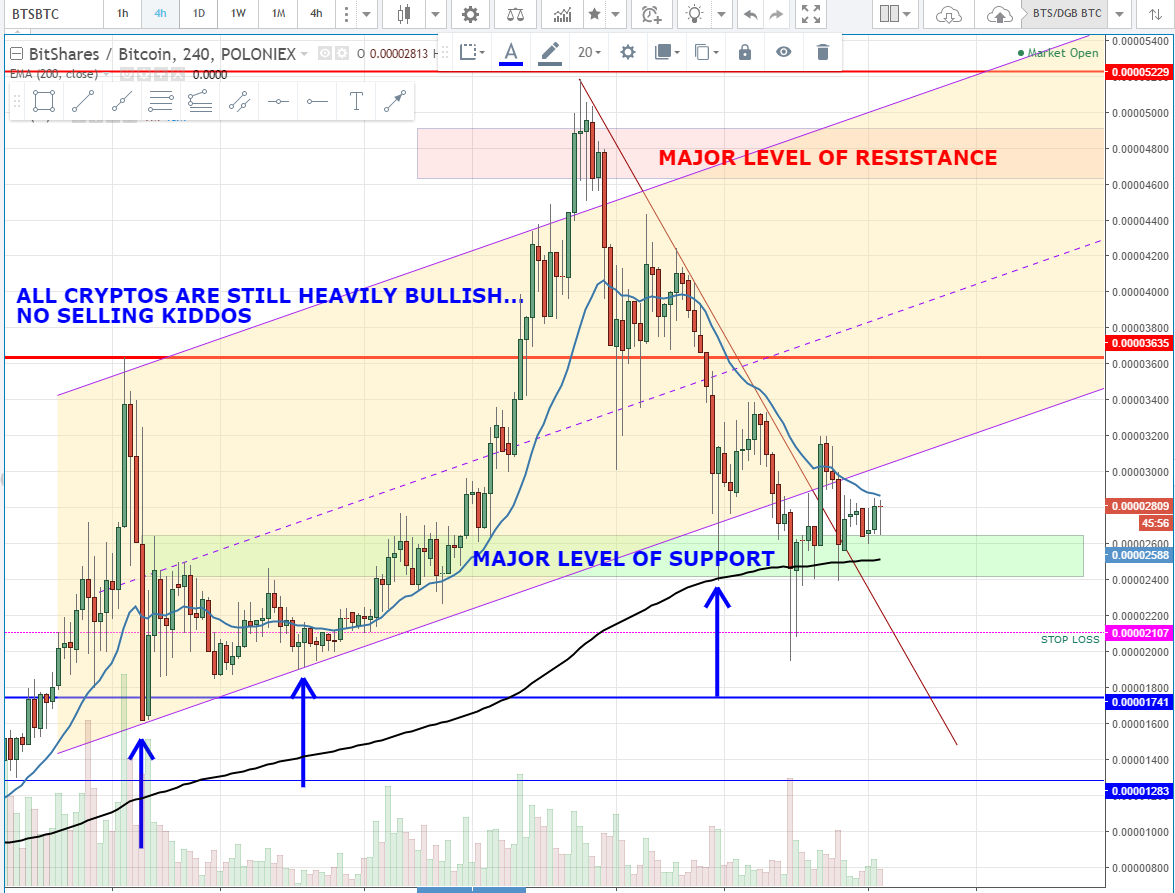
So is the case for all cryptos...no selling unless you want to have your head ripped off, stomped on, and spit on for going against a MAJOR BULL TREND!! The only selling you want to do is to take profits if you're trading short term.
[4HR CHART 1]
Currently on BTS/BTC we had a big sell off MAJOR RESISTANCE. But all cryptos recently had a major sell off, hardly can call it a crash, more like people taking profits from previous major run up higher across the crypt-sphere. I would't blame them, i mean when you get you get returns on an investment in the hundreds of percent, you take money off the table to minimize looses. Currently BTS is sitting on a major level of support as highligted by the green box and its bouncing off the 200DAILY EMA.
[4HR CHART 2]
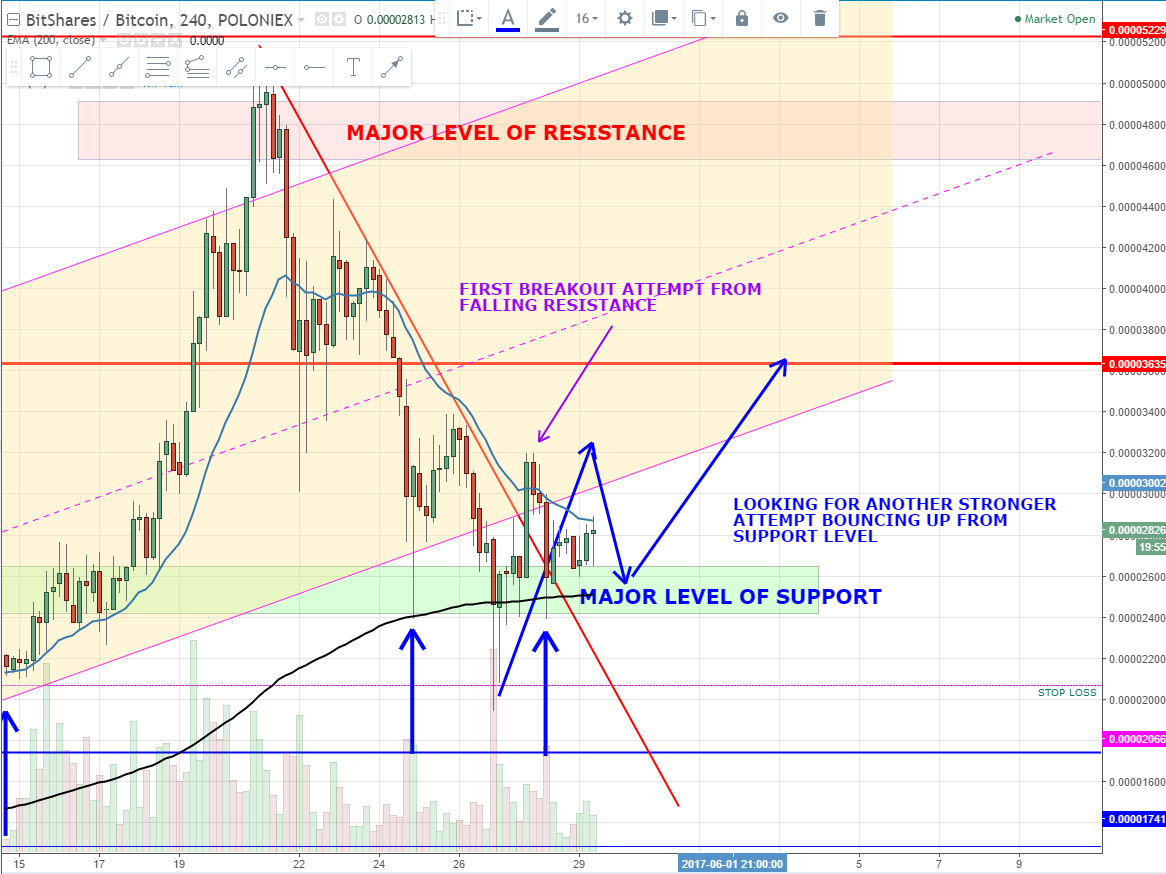
There is also a falling level of resistance being challenged. This resistance is part of the sell-off that occured accross all the cryptos ove the weekend. The area where its bouncing was previously identified as a level of support and it appears to be holding but no confirmation yet as we need to go higher up from this level of support.

[4HR CHART 3]
There has been one attempt to break out from falling resistance and it fell back to the support level. I would like to see a 2nd attempt rocketing out of that support level to give me confirmation of continued bullish movement. If it fails to go higher and major support level fails to hold, then there may be further down movement and we wait for another level of support before we look to go long again.
This not a signal service, nor is it financial adivse. You buy and sell as you please.
Happy trading folks.
As always in trading. If the support holds or the resistance breaks, we can make a trade. Thank you for nice TA.
Youre welcome.
Yep, gotta make sure support holds and look for strong bull candles off that support to go long again.
Good confluence of support and it's always nice to have the support of the 200 moving average along with horizontal (price structure) support.
The middle of the price channel that you drew in is begging to be tested again, IMO.
yeah, many traders look at the 200d moving average, so it helps to see what type of reaction we get from that level.
For sure.