BTC/USD 2 TA
Just an update on the current market of BTC/USD. Please note that this is just what I think is possible and I can be completely wrong. I have written the notes on the chart so it would be easier to follow.
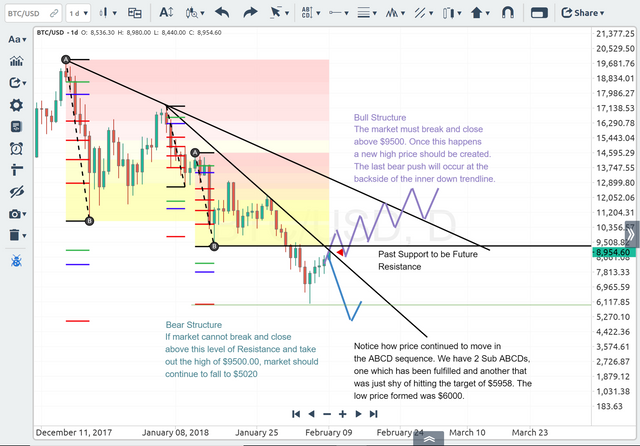
With the recent rally, I still believe that we are in a bear market since there is no bull structure forming at the moment, only another selling opportunity. This is why I think so. We turn to the 1 Hour time frame to look for this as the smaller time frame provides lower risk.
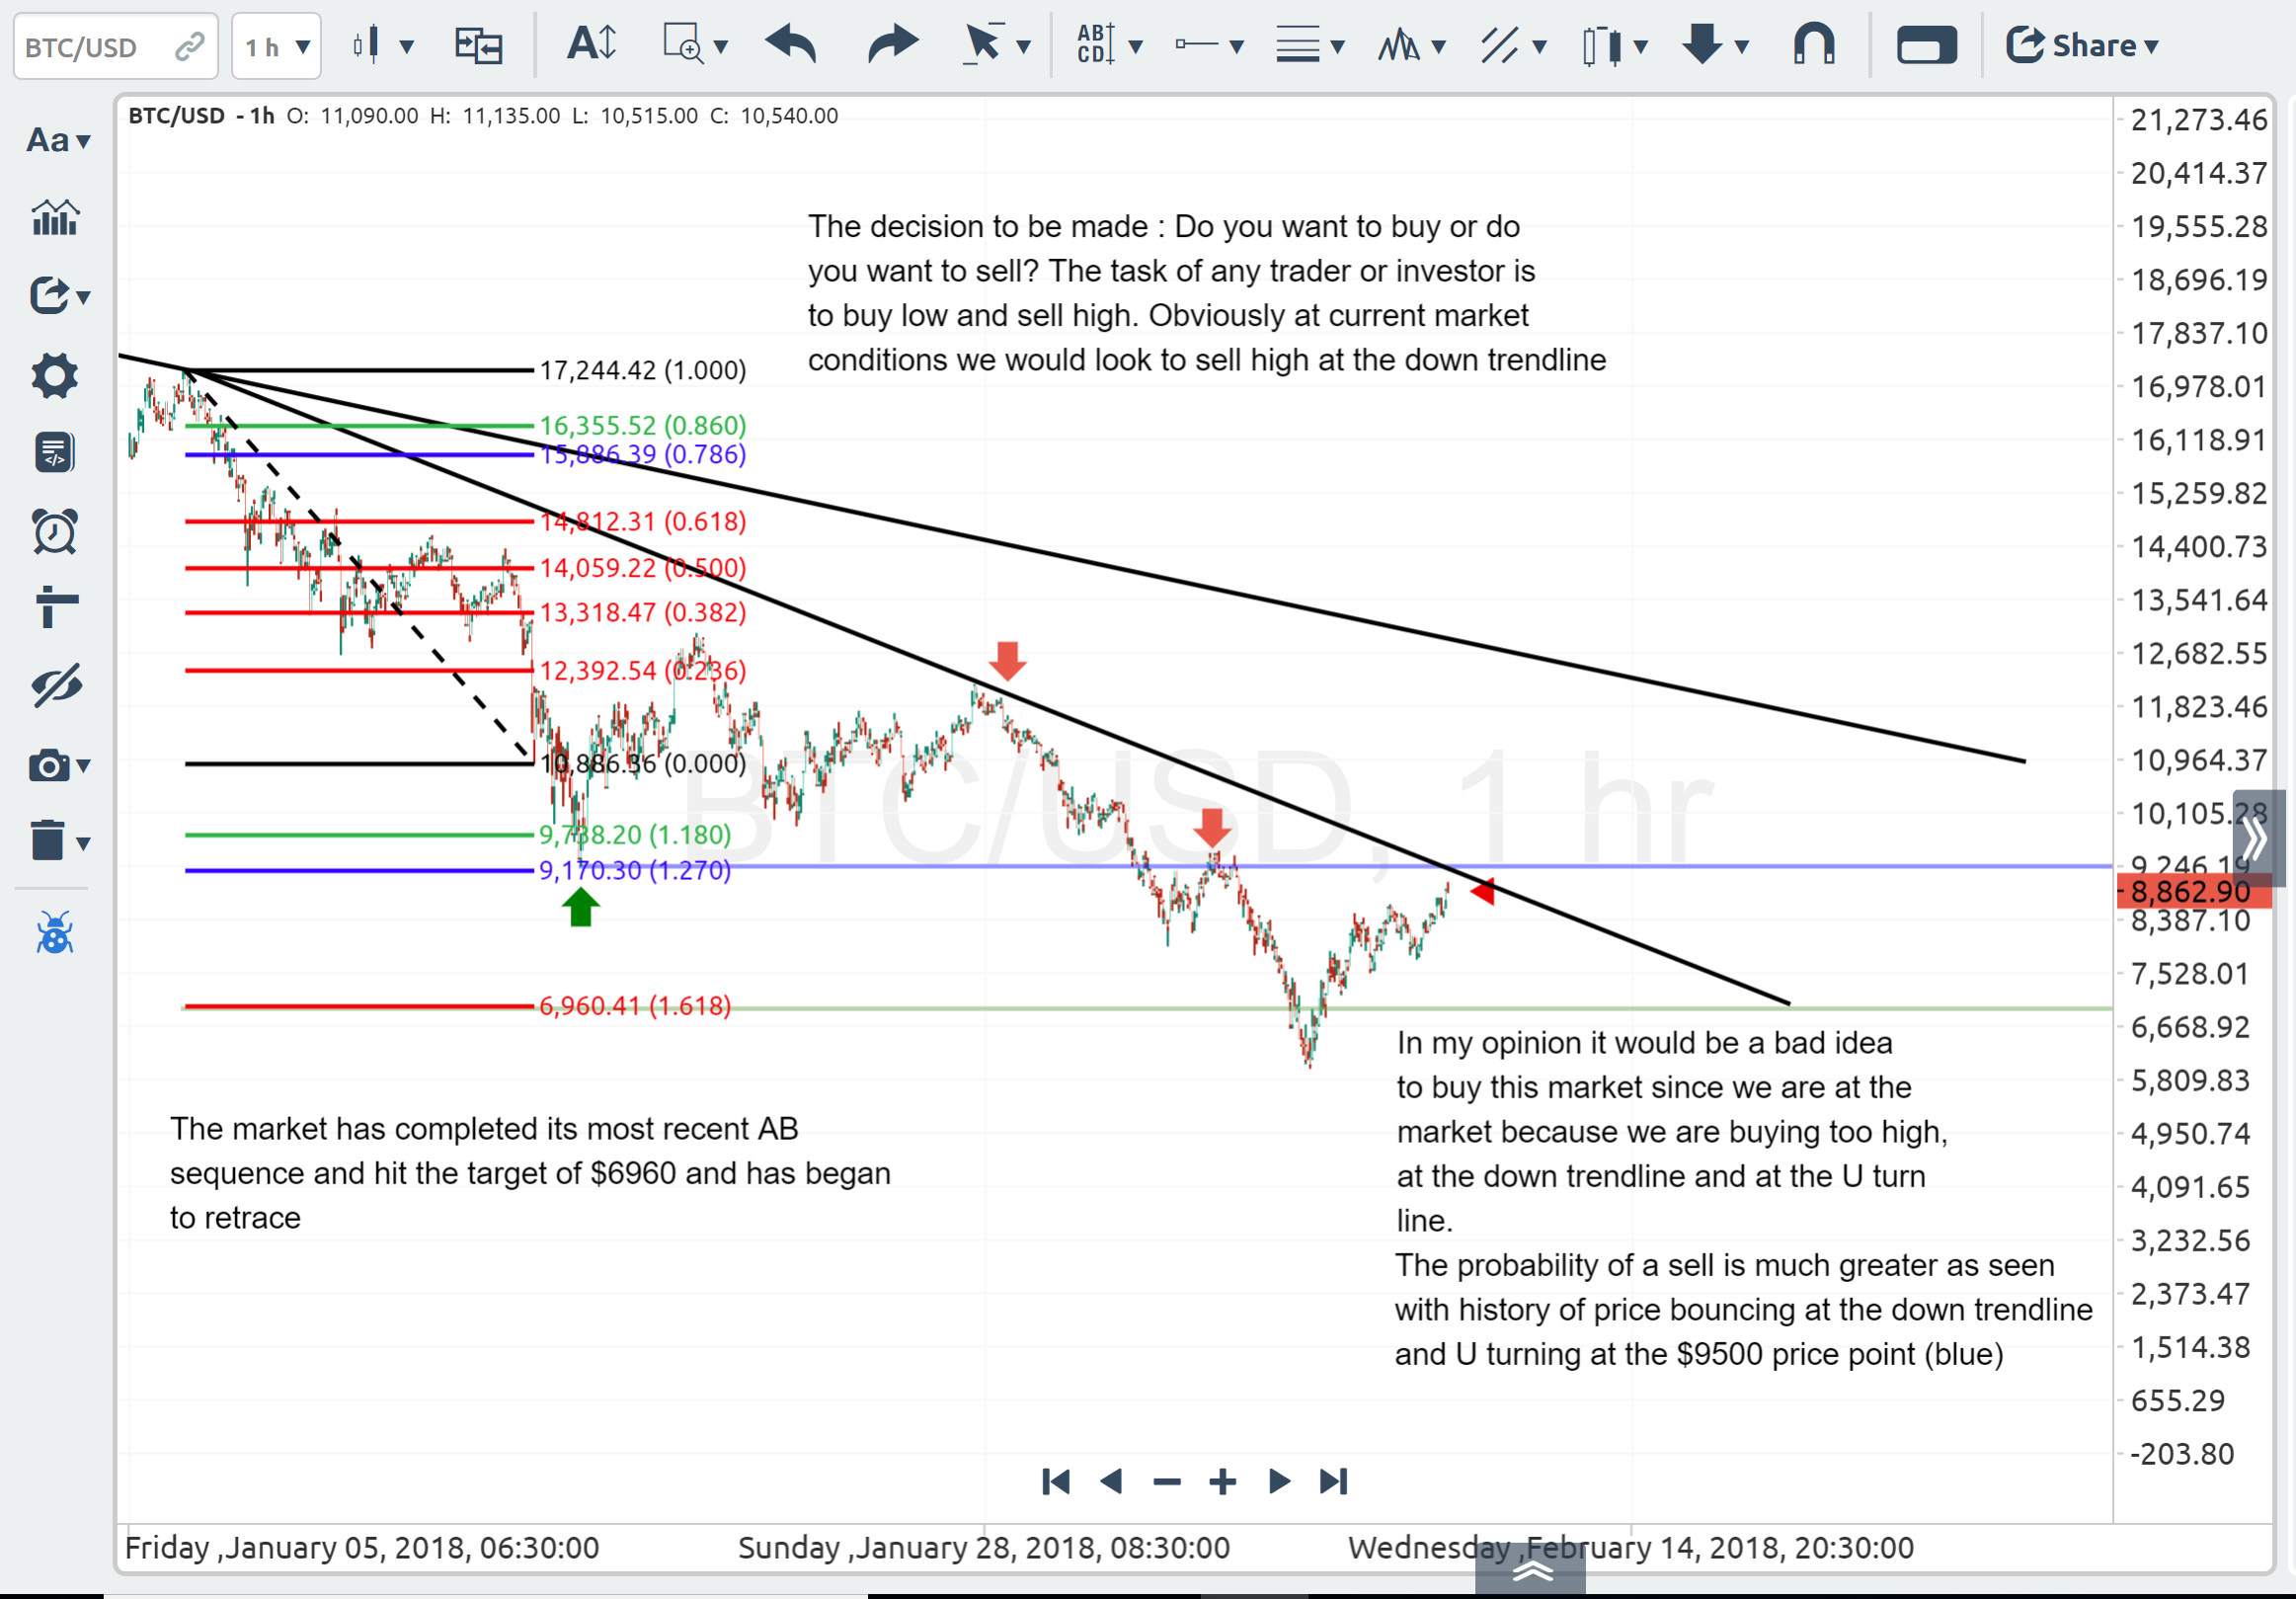
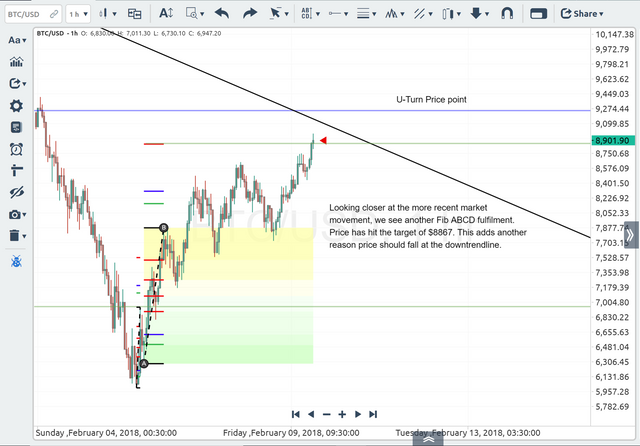
Now we apply more Fibs to the mix. Notices as I discuss more the current market candle at the time of this blog respects the Fibonacci as it is bullish (green) but later goes bearish (red) as it closes.
Some further projections
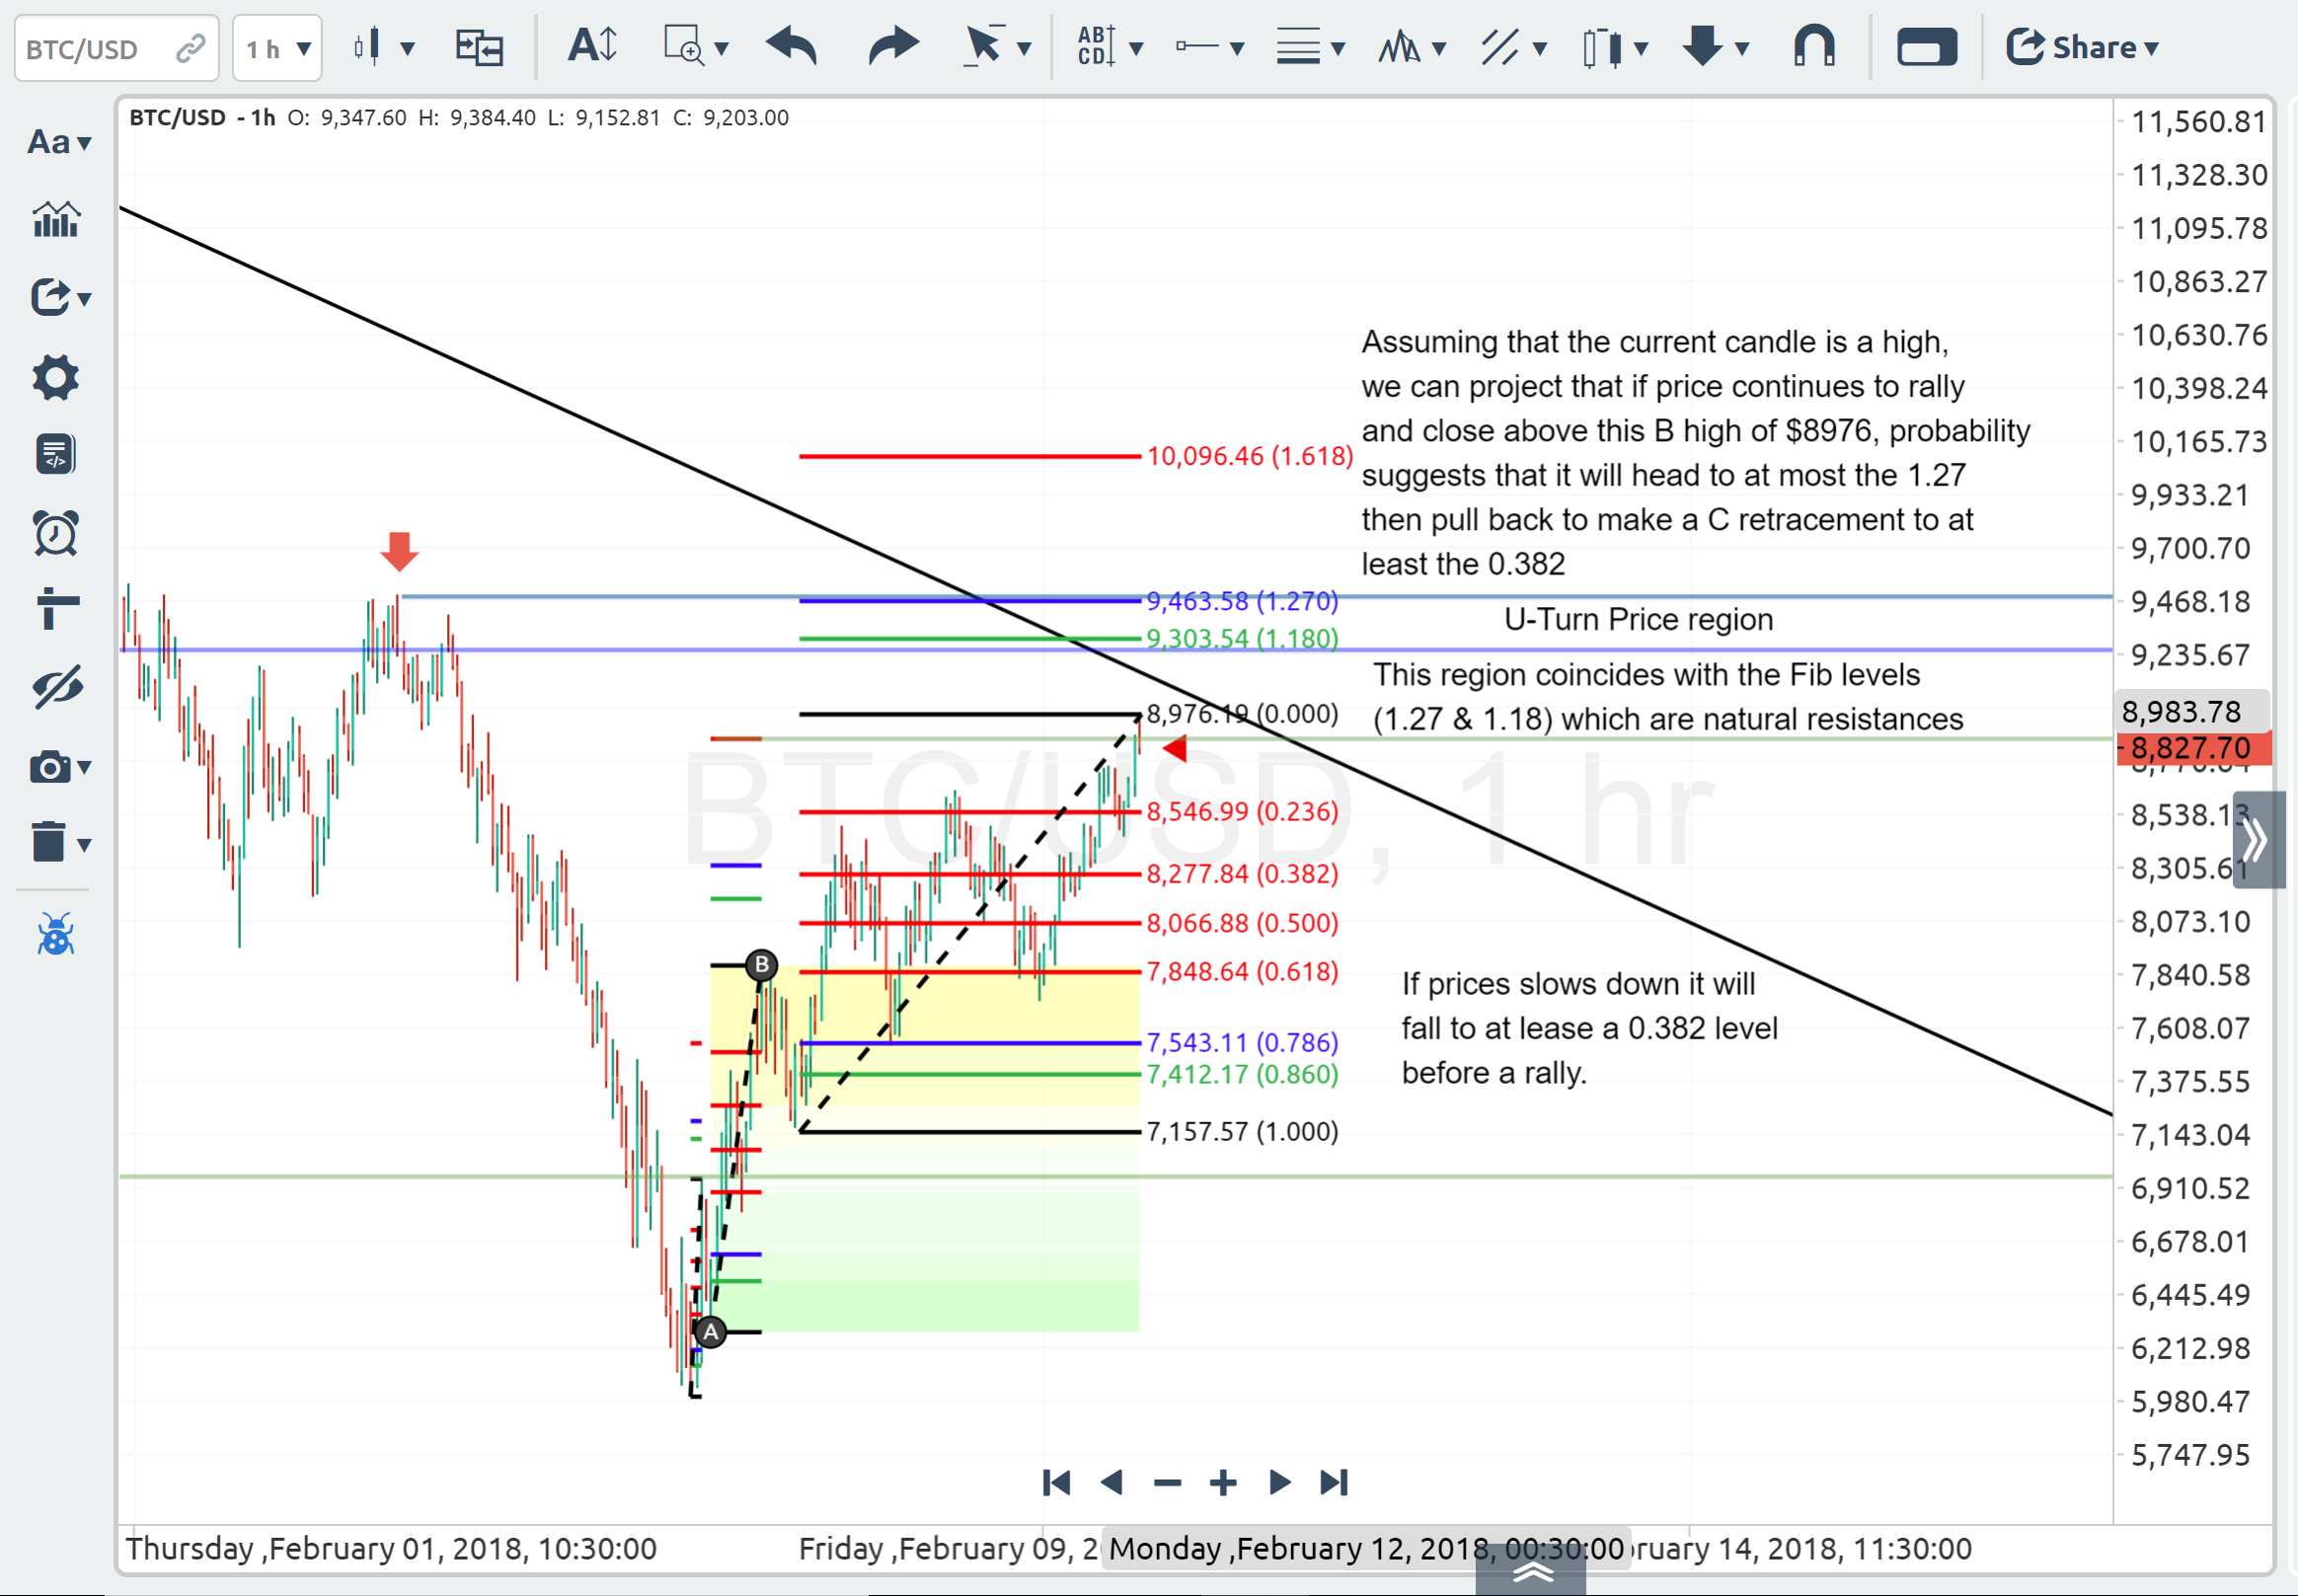
Now we look for the opportunities which can present itself.
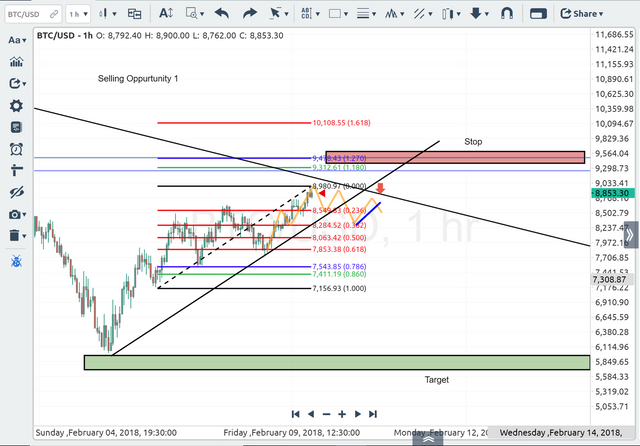
The targets are in the area that was highlighted in the daily timeframe analysis
The buying opportunity comes at a later period. Waiting for the current Fib to be completed for confirmation that bullish trending market will begin. This is so because after the 1.618 is hit, the price will retrace to the back side of the uptrend line with a low higher than the previous level of support. Buy with a counter trendline break bullish at the close of that candle. (The blue lines are the counter trend lines which apply to the selling opportunities as well.)
Thanks for reading. Hope it was worth it and interesting to you. This is how I analyze the markets and it applies to FX also. I wait for the trade setups then price buy or sell accordingly. (Yes I lose plenty trades, I'm not that good, still practicing). Patience is key!
-KvB
Thanks, very good post !!!!
Awesome Work!

Keep it up!!!
@cryptoinvestinfo