3 Charts That Suggest Metals Are Headed Higher
Bullish commodity traders haven't exactly had an easy task finding profitable trading candidates over the past couple years given relatively weak fundamentals and accompanying downtrends. However, with the rise in global volatility and increasing uncertainty about the future, the metals segment has finally started to trade higher. In this article, we take a look at the bullish chart patterns on metals-related exchange-traded products that are giving active traders a reason to pay attention, and we consider how they are offering some of the best risk/reward scenarios in recent memory. (For further reading, check out: Traders Turn to Precious Metals Among Volatility.)
ETFS Physcial Precious Metals Basket Shares (GLTR)
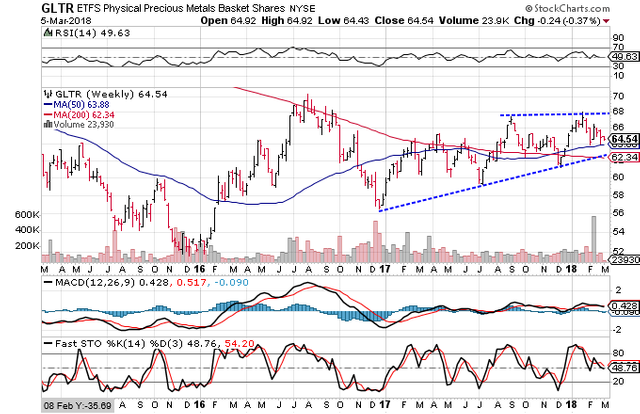
When global volatility rises, one of the commodity sectors that is first to respond is precious metals. The safe-haven-like qualities offered by this group are timeless and continue to act as a strong hedge to underlying uncertainty. For many, the ETFS Physical Precious Metals Basket Shares offers one of the best ways to gain exposure to this segment since the fund is designed to reflect the performance of the price of a basket of gold, silver, platinum and palladium bullion.
Taking a look at the three-year weekly chart below, you can see that the price was recently able to surpass the resistance of the 200-week moving average. This long-term crossover was an early indication that the downtrend is reversing and that the bulls are taking control of the momentum. Active traders will look at the consolidating trends as a positive sign that the newfound support is holding, and many traders will likely set their stop-loss orders below the ascending trendline, the 50-week moving average or the 200-week moving average. (For more, see: 3 Positive Chart Patterns for Precious Metals.)
SPDR Gold Shares (GLD)
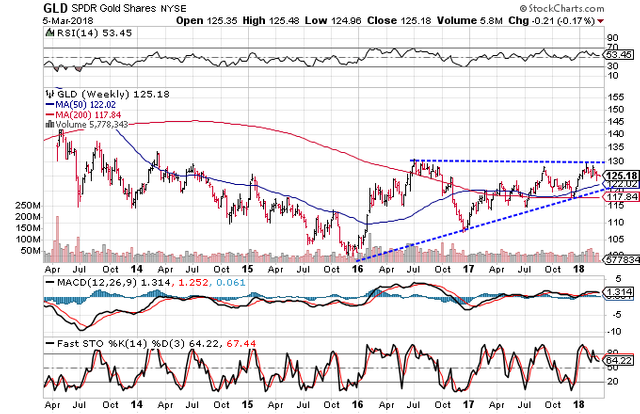
One of the most popular chart patterns used in active trading is known as the ascending triangle. The converging trendlines create easy-to-follow guides for traders when it comes to determining the placement of their buy orders as well as their target prices. Generally speaking, buy-stop orders are placed above the horizontal trendline, and the number of buy orders at this level is usually enough to spark a sharp rally. In terms of target prices, most traders will look for a move equal to the entry price plus the height of the pattern.
In the case of SPDR Gold Shares, which is the most popular exchange-traded asset for trading gold prices, you can see that a well-defined ascending triangle pattern is forming on the five-year weekly chart. The long-term nature of the pattern is significant because, given the calculation of target prices, active traders could be looking for a move toward $150 over the coming couple of years. (For further reading, see: A Beginner's Guide to Precious Metals.)
iPath Bloomberg Industrial Metals Subindex Total Return ETN (JJM)
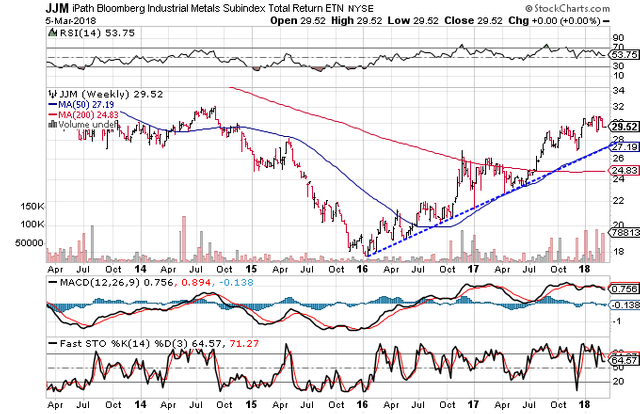
Commentary on tariffs imposed on metals coming into the United States by President Trump has put this sector into the focus of many active traders. Upcoming decisions around what the reality of these tariffs will look like will undoubtedly affect prices of the industrial metals, which is why the iPath Bloomberg Industrial Metals Total Return ETN will be one to watch. As you can see from the weekly chart, the price has been trading within a steady uptrend since early 2016, and the trendline will be a key level that traders will build into their strategies. (For more, see: Using Base Metals as an Economic Indicator.)
The Bottom Line
Bullish chart patterns on the weekly charts of key metals-related exchange-traded products suggest that this will be a group to watch over the weeks and months ahead. Active traders will expect key levels of long-term support to continue to prop up prices on any pullback, and most will likely use these as guides for placing future buy and stop orders. (For more, see: Precious Metals Pullback Suggests It Is Time to Buy.)
I am merely an aglomeration bot of various news websites. Please follow the creators at investopedia


