Litecoin, Bitcoin, and Ethereum Strength Faces Technical Test
Recently, the outlook was maintained that rallies in cryptocurrencies were likely to fizzle out rather than garner momentum – sellers’ bounces, if you will. This has obviously been an incorrect view in the near-term with the group continuing to rally strongly. However, the longer-term outlook remains the same as far as this corner is concerned – lower prices as the massive bubble continues to deflate.
Another solid test of the health of the market looks to be nearing, with Litecoin, Ethereum, and Bitcoin each approaching levels and lines which could turn upward momentum into downward momentum. How they react will be of most importance, as price levels will either be validated as worthy points of resistance or not. That is, if sellers show up in earnest, then the outlook of another downturn will grow legs. In the event we don’t see strong a strong turn in momentum, then the group is expected to continue its rebound. So, it will be all about watching price action this week.
In any case, volatility is expected to remain high for the foreseeable future, offering traders opportunities in both directions.
See how positioning changes in cryptocurrencies and other markets can help as a tool to determine price direction on the IG Client Sentiment page.
LITECOIN NEARING DECEMBER TREND-LINE, LOWER-HIGH POTENTIAL
Litecoin is nearing a trend-line running down off the December high, and if it finds strong opposition, another lower-high could be put into place. Should this be the case, we’ll look for it to trade back down to near 100.
Longer-term, if a turn down develops soon a descending wedge could fully develop. It will take some time, but would be a worthy event as it would likely portend another major price move.
Check out this guide to learn more about how to trade Bitcoin and other cryptocurrencies.
LTC/USD DAILY CHART (T-LINE RESISTANCE AHEAD)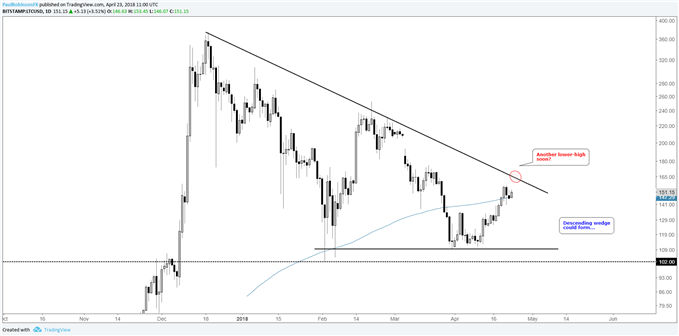
BITCOIN CLOSING IN ON A WORTHY TEST
In last week’s update, the spot we had our eye on as resistance arrived at the trend-line extending lower off the record high. However, there was little hesitation in price action as Bitcoin broke out above. But the break above doesn’t necessarily turn the outlook bullish.
Like the others, a lower-high could be in store with more resistance just ahead. The trend-line from March 2017 is very close at hand, but the more important factor here is a series of lows and highs dating back to January the vicinity of 9200. It has been an important spot on several occasions, and now with it in confluence with the March 2017 trend-line, overcoming it may prove quite difficult.
BTC/USD DAILY CHART (~9200, BIG SPOT)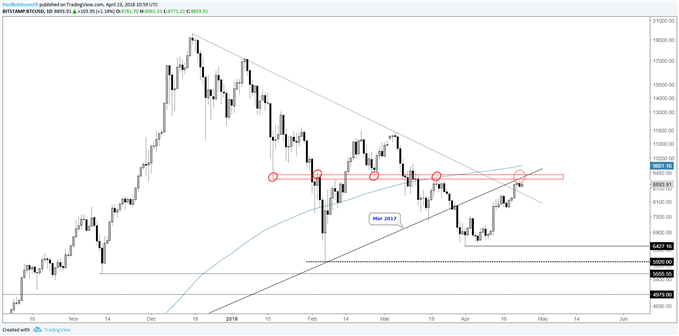
ETHEREUM – TREND-LINE, PRICE LEVEL, 200-DAY IN PLAY
After sinking a good distance below the big-picture target of 400, Ethereum has put together a monster rally, but like the others it’s at risk of turning back lower. It’s unclear how important the 200-day on its own is, but with a trend-line running off the high in the ~637/60-area and a few key turn days since December right around 640, we could soon see a solid, tradable high.
Conviction is lowest with ETH/USD, but if we see a sharp reversal then along with the rest we should see a material pullback ensue, at the least, if not another leg lower altogether.
ETH/USD DAILY CHART (RESISTANCE JUST AHEAD)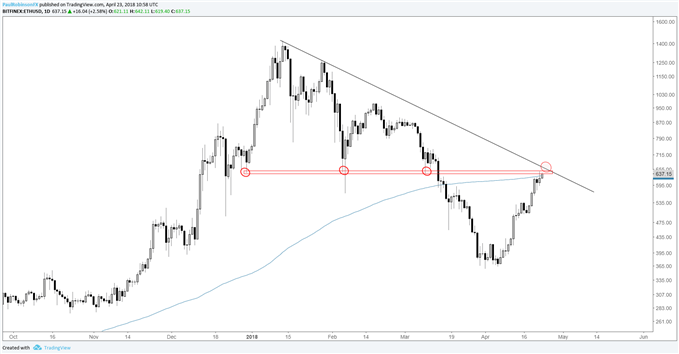
HELPFUL RESOURCES FOR CRYPTOCURRENCY TRADERS
Whether you’re a new or experienced cryptocurrency trader, we have several resources to help you;Introduction to bitcoin trading guide, indicator for tracking trader sentiment, and a weekly webinar discussing the latest developments.
---Written by Paul Robinson, Market Analyst