Bitcoin looks pretty good... :)
Hey ho,
yesterday i posted an short article of the chart of bitcoin in german. Here is the translation in english :)
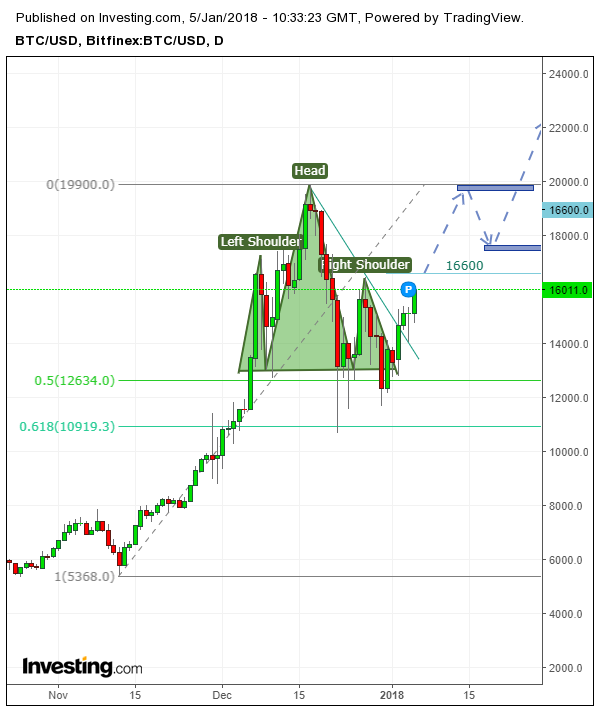
First let´s take a look at the Chart of Bitcoin/USD. It seemed to be a bearish Shoulder-Head-Shoulder(S-H-S) Top-Formation first, which turned around. Prices which goes higher above the Shulder negate this formation and are often used from Trader´s as a Stop-Level.
The price at 13.000 $ called the bulls back. The price is at about 15.800$ at the moment, a really important level. There is a resistent zone, which was formed in december. Should this zone will be overcomed, the picture of the chart will look much better. Prices above 16.000$ would significantly increase the chance for an end oft he correction. The correction would have found its bottom at the 50% Fibonacci-retracement at around 12.363$ on a daily closing price basis.
.png)
Even though the mainstream media wrote about a crash in Bitcoin 2 weeks ago, I continue to be bullish: D. My first target on the long side is near the high of December 17 at around 19,810$, which is likely to be corrected. This may be a good entry level to jump on the train towards new all-time highs. :) I hope you could use something from it for your trading.
(English is not my mother tongue, so please excuse any errors on my part ;) ....)
Disclaimer
The analysis is not a buy or sell recommendation, it only reflects the opinion of me. Trading in stocks, Forex and Crypto currencies are high risk invests.