BTC / USD Technical Analysis May 22, 2018
BTC / USD Technical Analysis May 22, 2018
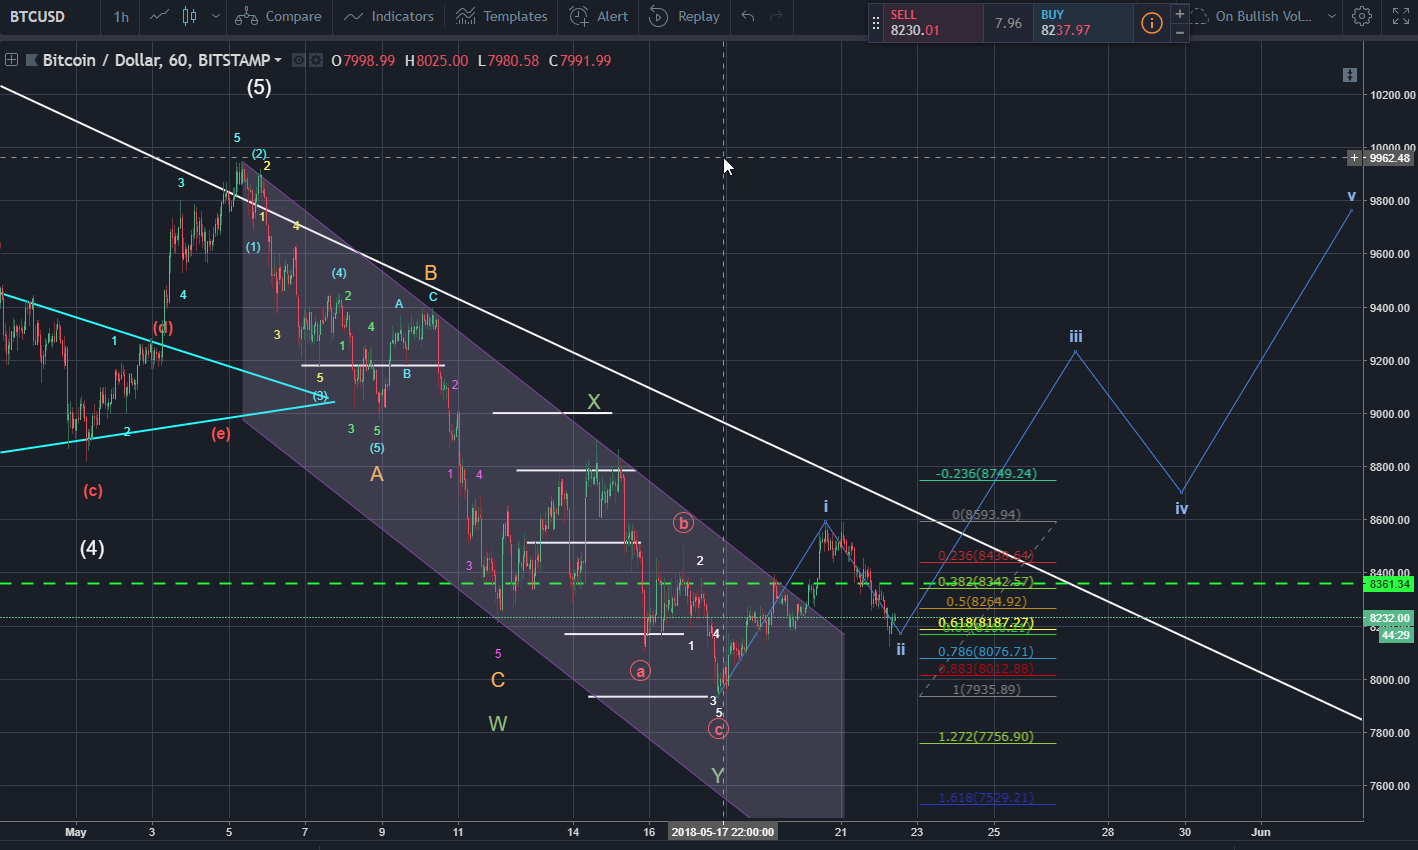
I haven't changed my impulsive Blue wave since I called the end of the correction on May 19th. It's amazing how closely it's following the blue wave.
It looks like we have reached the bottom of wave 2 this morning (8 AM CST) bottoming just below the golden zone between 0.618 and 0.65 fib by a wick.

Long Term View
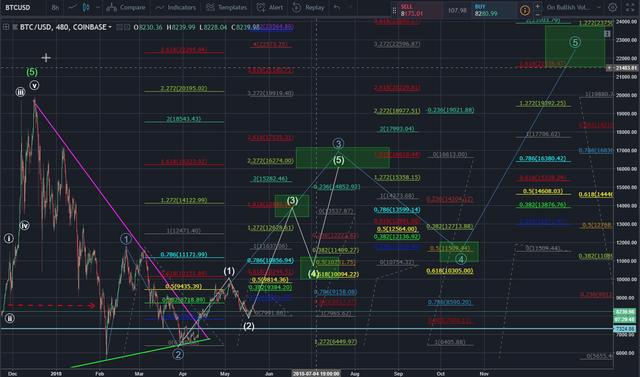
Looking out through the rest of 2018 looks like this. The chart looks a little cluttered but I have provided the fib retracements and fib extensions for you to see how I am conservatively projecting the price of BTC in 2018.

If you need to zoom in, Hold down the Ctrl key and push the + key until you mazimize it on the screen to your liking.
If this chart is correct, we are heading into the 3rd wave of white Intermediate wave and the 3rd wave of the Blue Minor wave. Since the 3rd wave is usually the strongest and most impulsive wave, we should start to see big impulsive moves soon and through mid summer or so.
We'll see how this plays out. I believe everything is lining up for a massive move in the cryptoshpere this summer.
Note: If I'm long term investing in a coin I will hold a portion (10 - 25%), preferably in secure storage without trading them.
Disclaimer: This is my personal technical analysis. You should not trade cryptocurrencies without taking full responsibility for your own decisions. I will NOT be responsible for any loses you may have incurred based on my TA. Responsible money allocation is key to not gambling all your investments on one or a few trades. I am now a professional trader but am still learning the hard knocks and realities of swing trading full time. I take responsibility from my own decisions, so should you.