Remember 'big money' looks at the 1 day candle charts, so lets join them
As the title says the most looked at chart by experienced traders is the 1 day candle. By 'big money' and 'experienced traders' I am referring to the wave of institutional money that is hypothesized to be flowing into the space.
So I thought it might be useful to look at the 1 day chart and highlight a few of my thoughts.

The chart covers the last 4 months, most of the lines are from the indicator 'ichimoku cloud' which has the standard values.
Also here is the green, orange, red and blues lines that are the 30,50,100 and 200 moving averages.
The 2 parallel straight yellow lines are lines I drew in the represent the top and bottom of a year long channel I believed we were in, which we broke out of around 26 november.
Mostly bullish
Firstly I'd like to point out that the chart is mostly bullish and you can still defend a long position using it.
The cloud is green and price is above it, the price is above the 50,100 and 200 day averages and price is still above the year long trend channel.
Most positive and recent is the fact that in has twice bounced off the 50 day moving average and in the last few hours may of bounced a third time (it will require a few days to confirm this)
Warning signs
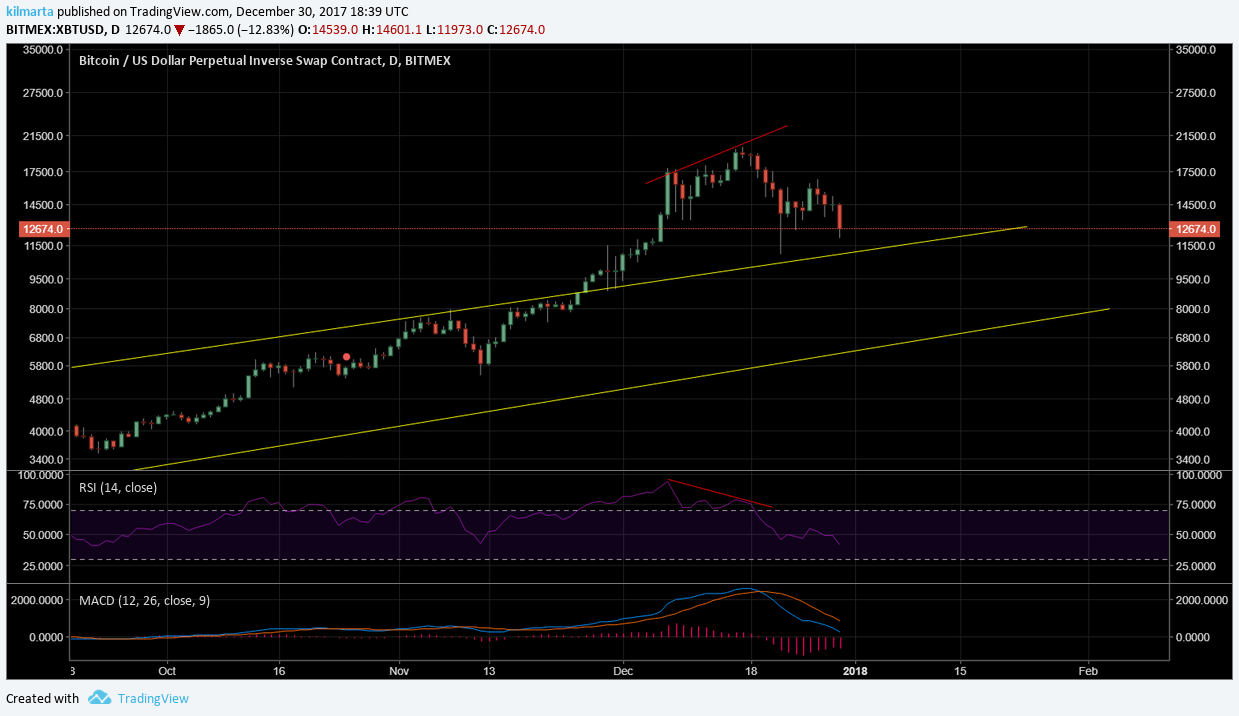
Between the 7th and the 17th of this month we got a bit of a divergence on the RSI, the red lines. Which likely would of got you reducinging your long, at the least.
Then just a few days ago we got the tenkan (light green) and kijun (light red) lines cross bearish. Again not a sign to short but definitely a sign to reduce your long more and maybe close it.
What to look for in the next week or 2
I will be looking at whether that 50 day moving average holds as a support, especially with it being so close to the long term trend line.
I have/had buys set at both points, the low 12's hit and I am long again. I will be looking to increase to those the next day or two if the 50 line holds.
Bearish possibilities
The aforementioned long term trend line, currently at around 11k which is also the recent low, needs to hold or we could see a retest of the bottom part of the trend (bottom yellow line). This edge to edge fall would likely take weeks and could put us somewhere in the 7k region.

My plan
As said I had some buys hit at low 12's and will add to them if we are above ~$13500 tomorrow.
I then have buys set around 11K for an expected bounce of the long term trend line. Stops for both of these are soft stops around 9.5K.
This will also be the spot where I will think about getting into a short down to the 7k region, I am quite long term bullish with the expectation of an ETF and institutional investors continuing to enter. So I may just use the fall as good entries rather than a small short.
Thanks for reading. Would love to hear some feedback and what you agree with and/or disagree with.
p.s As I wrote this it seems the bounce on the 50 average might be real
Advertisement
My favourite site for trading is Bitmex, as the future contracts allow for lots of arbitage opportunites and the leverage lets me leave most of my stash safe in cold storage. If you don't already use it and would like to sign up, here is a referral link that will get you 10% off fees and rewards me with 10% of the fees you pay, we both win.
More posts
If you like this post there will be more like it on my posts page, this account will be dedicated to posting about trading cryptocurrencies and maybe a bit of general stock markets.
If that sounds good please consider upvoting, following or resteeming. If you are feeling particularly wild you could do all 3.
Disclaimer
Please do not invest on the advice of a stranger on the internet, only use this advice here as a starting point for your own research, and then if you choose to invest please only invest an amount that you can afford to lose.

Made with this pic as a template
Great advice to keep in mind @kevinbacon! Keep these coming, great analysis.
i share your dreams keep it up
I'll follow you thanks for this article