Math-Based Fundamental Value Analysis Has Been Right About Bitcoin Bear Trend So Far - What Does it Tell Us About When Sustained Growth Will Return?
Nearly two months ago, here on Steemit I had written a couple of articles pointing out that the trading analysts were leading people wrong by forecasting bullish trends and a recovery of bitcoin values when it had apparently rebounded from its initial drop to around $6,000.
Feb 12 2018: There is Little Chance Bitcoins can Sustain any Real Recovery Until This Fundamental Metric Begins to Turn Upwards Again
https://steemit.com/bitcoins/@kenraphael/there-is-little-chance-bitcoins-can-sustain-any-real-recovery-until-this-fundamental-metric-begins-to-turn-upwards-again
Feb 17 2018: Bitcoin Has Not Yet Fundamentally Recovered At This Time – A Mathematical Case
https://steemit.com/bitcoin/@kenraphael/bitcoins-have-not-yet-fundamentally-recovered-at-this-time-a-mathematical-case
A mathematical modeling of the fundamental metrices showed that such a recovery was virtually mathematically unlikely. It would take an enormous printing of fake demand (if indeed tether or some other entity engaged in that - a mathematical feasibility based on the numbers) to prop up that kind of recovery.
The fact is that mathematical modeling tools remains probably the most accurate measure of the rough trend of a market valuation of an asset. And cryptocurrencies with the wealth of data available publicly on the blockchain presents the a good number of metrices to perform such analysis.
How Many Bull flags, Reverse Head & Shoulders, Wedges, And Breakouts Have You Endured the Past Two Months?
There is nothing wrong with bitcoins going through several month long correction. Overall, its current price compared to six months ago still beats most assets on the stock market. But patience was required. And following the wrong prognostications of trading analysts does not help with that.
You can compute the gains you would have made following the call from this blog in February rather than getting in at S11K, $10K, or $9k by listening to social media trading analysts that draw lines without any sound basis, and label it science.
What Do the Fundamental Metrices Currently Show?
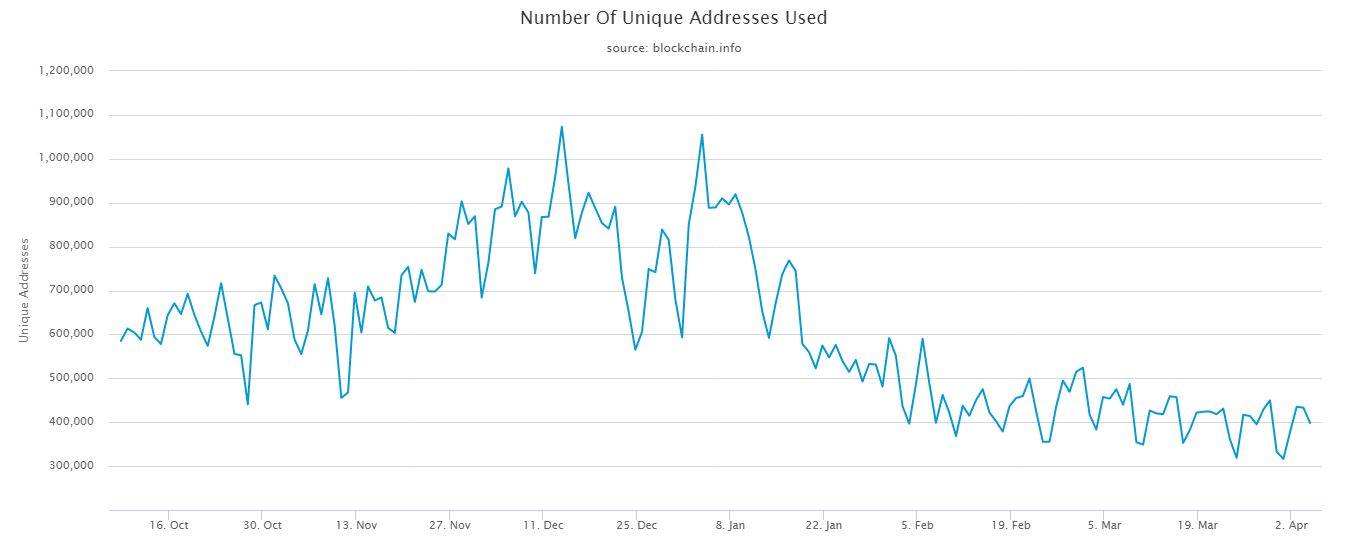
In order to tell when the bear market would be over, let's go back to the single most correlating metric - the daily unique user address growth rate:

Source: https://blockchain.info/charts/n-unique-addresses
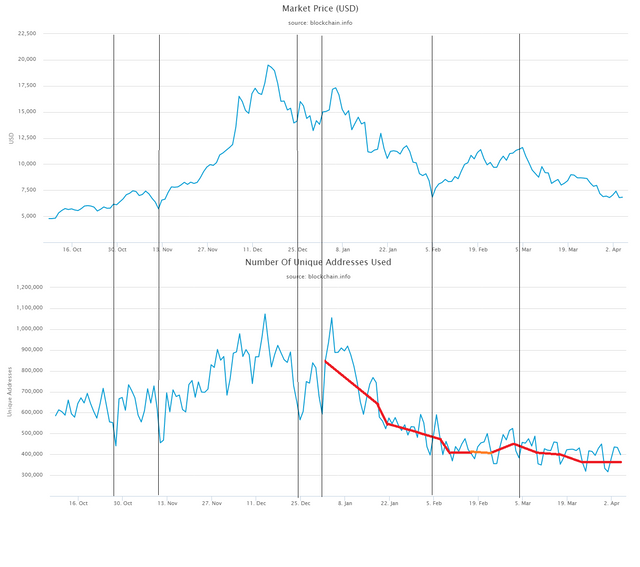
We notice that the value remains low even today, and with it the market price. However, at this time it also appears to have stabilized and no longer falling rapidly as it was doing earlier in the year. (When this was presented in one the above blogs, there was a comment that the user adoption rate does not need to grow for prices to grow. That would be mathematically unsustainable in the long term because only demand can prop up the price of any asset long term - for a virtually fixed rate supply asset like bitcoins. And unless demand is artificially printed, when you see dropping demand it actually does not take much modeling to face mathematical reality o prices following soon.) Below is the market price in comparison to the above daily new user addresses for the same period.
When will the Downturn End?
The DUA seems to be leveling off slowly. In fact, today's chart showed a slight week on week uptick - the first clear WOW uptick since early February. Based on this metric, it would be surprising to see values fall to the 3,000 levels as some have now started suggesting. (Possibly a major event such as SEC action on tethers or a major exchange crash or hack could move things to such levels now looking at the stable leveling of the DUA.) Other fundamental metrices such as network fees and confirmation time also remain low.
So some form of slow recovery could be around the corner. However, there are few things that could speed up a return to late 2017 DUA growth rates. One is if newly released technology such as Lightning will begin to demonstrate really cheap transfer rates and Bitcoins begins to more rapidly take over functions that Western Union and Paypal used to perform; or demonstrate growing use cases. The other is if new tether printing can drive prices up and draft new user growth along with it. But apparently the rate of printing of tethers seems to have slowed to nearly stopped for some unrevealed reason since Jan 2017 (as seen on coinmarketcap.com.) And the recent activism of the SEC in arresting questionable practices in the cryptocurrency area may further dampen the enthusiasm to print demand; if some of that was previously going on. The success of the technology would be the more welcome and sustainable path to growth, but will likely take several months to unfold.
The daily unique user address growth rate can be followed at the link already presented above. When that begins to grow again then the asset price would likely follow, just like it has done for the prior nine years, and in accordance with fundamental economic principles. However, timing the precise bottom might not be feasible. For instance, it would be preferable to maybe get in at say $7,000 for a $6,000 bottom; or at $6,000 for a $5,000 bottom; after establishing that real growth has returned to the market, rather than to keep guessing when the chart readers will eventually make a correct call. It may also be pointed out that ultimately, there is not much comparative leverage between getting in at $4,000, $5,000, or $6,000 when it gets to a new ATH (above 20K.) In short, the risk of waiting for lower entry points might outweigh the gains of getting in at those lower levels at this point. Watch this blog as well, as the evidence of real growth will be called for what it is, having no vested interest either way in making false bullish calls.
Other Articles by the Author
Mar 17 2018: Lightning Was Released This Week – What Will be the Impact for the Bitcoin Network and the Cryptocurrency Market?
https://steemit.com/bitcoin/@kenraphael/lightning-was-released-today-what-will-be-the-impact-for-the-bitcoin-network-and-the-cryptocurrency-market
Mar 16 2018: Social Media Trading Analysts Are Likely Mostly Doing a Disservice to the Blockchain Community
https://steemit.com/bitcoin/@kenraphael/social-media-trading-analysts-are-likely-mostly-doing-a-disservice-to-the-blockchain-community
Mar 09 2018: Blockchain Technology Potential (Series 1) – A Review of a Recent PAYPAL CryptoCurrency Patent Filing and What It Means for the Future of the Technology
https://steemit.com/bitcoin/@kenraphael/blockchain-technology-potential-series-1-a-review-of-a-recent-paypal-cryptocurrency-patent-filing-and-what-it-means-for-the
Mar 07 2018: Audit the Teths – A Macro Case for Why Tethers Need to be Audited for Confidence to Return to the Market
https://steemit.com/bitcoin/@kenraphael/audit-the-teths-a-macro-case-for-why-tethers-need-to-be-audited-for-confidence-to-return-to-the-market
Feb 24 2018: A Review of a Few Fundamental Metrices that Drive Bitcoin Value and What They Currently Indicate
https://steemit.com/bitcoin/@kenraphael/a-review-of-a-few-fundamental-metrices-that-drive-bitcoin-value-and-what-they-currently-indicate
Feb 17 2018: Bitcoin Has Not Yet Fundamentally Recovered At This Time – A Mathematical Case
https://steemit.com/bitcoin/@kenraphael/bitcoins-have-not-yet-fundamentally-recovered-at-this-time-a-mathematical-case
Feb 12 2018: There is Little Chance Bitcoins can Sustain any Real Recovery Until This Fundamental Metric Begins to Turn Upwards Again
https://steemit.com/bitcoins/@kenraphael/there-is-little-chance-bitcoins-can-sustain-any-real-recovery-until-this-fundamental-metric-begins-to-turn-upwards-again
Feb 09 2018: This Single Metric Seems to Correlate More with CryptoAsset Values The Past Two Weeks Than Most Predictive Methods
https://steemit.com/cryptocurrencies/@kenraphael/this-single-metric-seems-to-correlate-more-with-cryptoasset-values-the-past-two-weeks-than-most-predictive-methods
About the Author
Ken has a doctorate in Engineering, and a master’s in Computer Aided Engineering, An IT professional, programmer and published researcher with over thirty publications in various fields of technology, including several peer reviewed journals and publications.
Legal Disclaimer: I am not a financial adviser and this is not financial advice. The information provided in this post and any other posts that I make and any accompanying material is for informational and educational purposes only. It should not be considered financial or investment advice at all. You should consult with a financial or investment professional to determine what may be best for your individual needs.
This is only opinion. It is not advice nor recommendation to either buy or sell anything! It's only meant for use as informative, educational, or entertainment purposes.
Upvote/Resteem/Comment. All comments are upvoted. Everyone that resteems gets a 100% upvote on comment here or their own blog. Let's start a conversation.

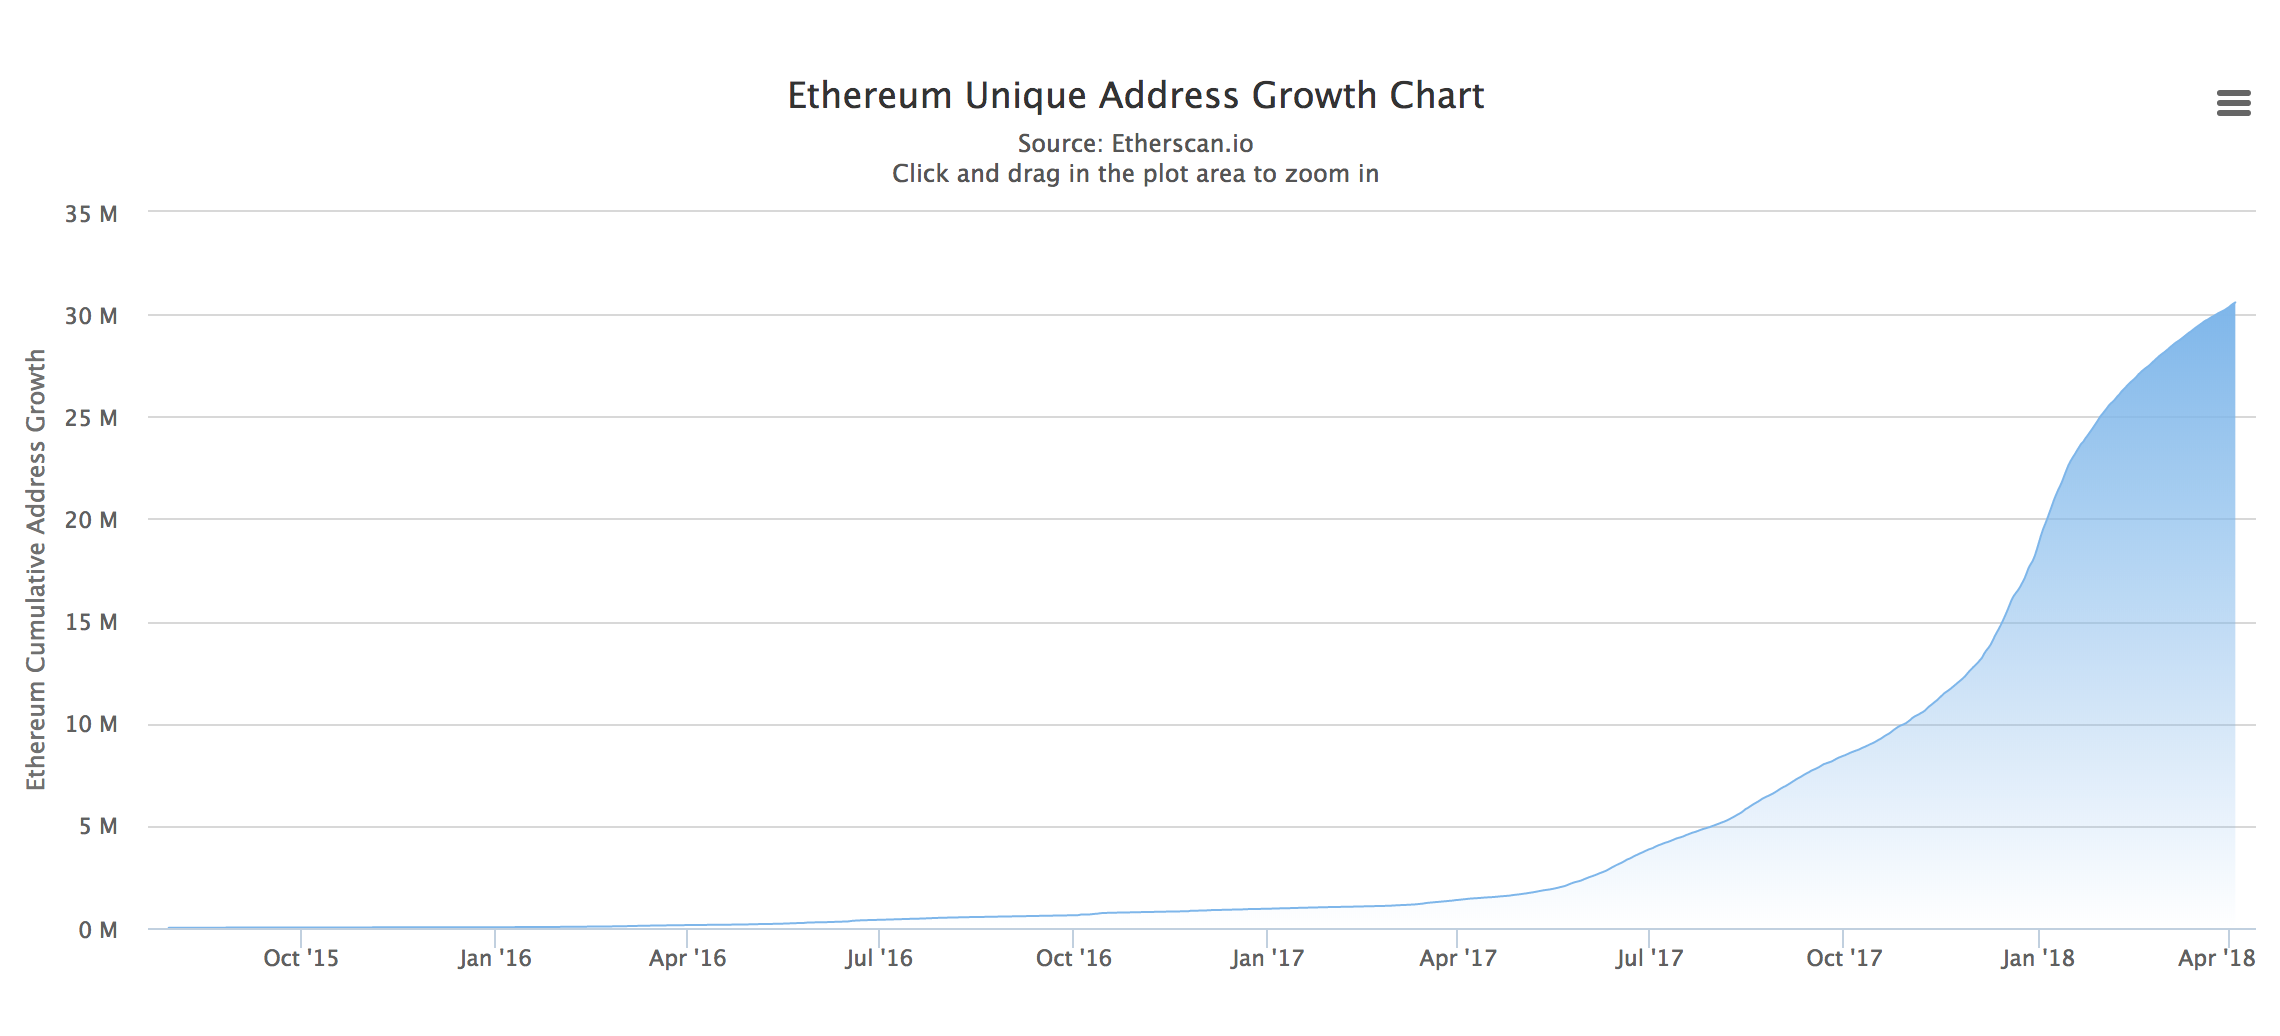
Thanks for pointing this out. Comparing the Bitcoin fundamentals against Ethereum, there's a massive growth story for ETH. I think its very possible to see ETH flip BTC at some point when comparing the two.

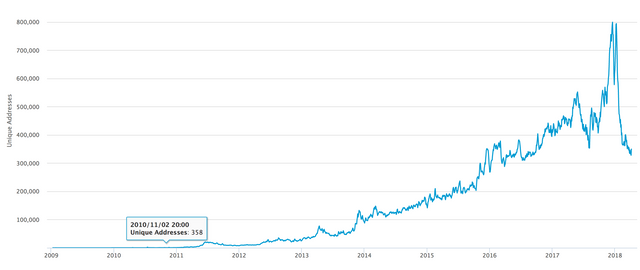
That is indeed looking possible based on the numbers and the trend. I should point out though that it looks like the above graphic is comparing cumulative unique addresses in ethereum with just the new daily unique addresses in bitcoin, so some care needs to be taken with such comparison because they'd be different quantities. But your point is well taken. And some of that is evident in this peer reviewed journal article: https://www.sciencedirect.com/science/article/pii/S1567422317300480
I agree there is a good possibility of that too, especially considering the real world practical utility value of Ethereum.
in capitalisation yes, but not in value. ETH coins are much more and easier to create than BTC.
So to summarize optimism is here for bitcoin I like it. Thanks.
I wouldn't quite take this that far yet. Some caution is still necessary here I believe. The DUA might have leveled off from falling precipitously but it is far from growing at strong enough rates yet.
I like the idea of using daily unique user address growth rate. It makes sense to me, that when more people start entering the market, demand will increase. I have tried counting waves and looking for reverse head and shoulders, but confuse me!
I sold my bitcoin when it was way up from my purchase price, because I believed people were buying based on FOMO. It was a gut feeling, that I should lock my profit.
Looks like that was a good call at the time.
Good sell, now you should be buying back, all the way down below 5k. This is the patient stealing from the impatient here. :)
I have been buy back a little at a time. I'm a big believer in cost averaging,
Long term view wins, too many people want to get rich fast.
Great work here. Daily user growth was what helped me hodl in 2015.
Great Article! Thanks
Excellent fundamental value analysis info here, @kenraphael! This is certainly a valuable analysis method to take into large consideration. Thanks for sharing this.
Followed and upvoted. Good material.
I disagree with comments on $4K or $6K as entry points. That is the difference in a 5X or a 3X gain when BTC goes back to $20K.
I think BTC could get down to $4,000's before we see a bottom.
https://steemit.com/bitcoin/@davebrewer/bitcoin-prices-won-t-be-at-the-bottom-until-they-drop-down-into-the-usd4000-s
That remains a possibility. But it is looking more likely that it would need an adverse event or two to step it down further to 4k levels. And yes anyone would prefer 5x over 3x. The point is whether to choose a guaranteed 3x or a riskier 5x and end up with 2x or worse? But I won't quibble much with a strategy that goes for a big gain by waiting for 4k levels, but it may require more watching and diligence.
Patience and diligence are not hallmarks of many noobs in crypto space. But it will deliver the best result
This post was upvoted and resteemed by And upvote service @okankarol
Thank you for using @okankarol
The service will be completed within 15 minutes.
Service Completed.
Great post and very useful information. I like your approach of looking further into the new account creation chart. But somehow that information could also be misleading because it doesn't says anything about the quality that each account brings with. Lets say how many transaction is this new account going to create and how many bitcoins it will hold? Do you think it would be better to look at the overall transaction per day or maybe transaction volume per day? Follow Up&Re
The overall "matrix" that we use for valuation considers those other factors as well. But over time we have seen that the DUA on its own well alone even before adding those other metrices. You know why? Because when you randomly have 300,000+ people joining a network daily the quality ratio begins to kind of also average out with the deviation in q.r reducing as the numbers grow. What this means is that all the bum accounts wont just collaborate to say enter on Monday and the high quality addresses enter on Tuesday. You start getting close averages in quality entering with each day's batch.
You will find in the archives of this blog, charts that have also introduced and used some of those other metrices.
Good post. It's nice to see effort and thought put into content. I wish I could upvote you more than once.
Unique addresses is an interesting metric. It's not surprising that Metcalf's Law maps nicely onto the Bitcoin network. But it doesn't capture the whole picture as it is based on the number of potential connections in a network, not the actual connections. The number of unique addresses could be constant while the number of connections rises - a connection in this case being a transaction between two addresses. Maybe another interesting metric would be the number of unique address pairs? Or clusters, since you can have more than two addresses in a transaction.
Agreed about the potential of looking into such other connections, though admittedly those would take some time and a little more coding. The good thing is that for the first time, we actually have a transparent financial network that will allow us extract and analyze such data. And we are still looking into other metrices that would help the understanding of trends, behavior, and responses in such networks suing such metrices.
The transparency of the data is fantastic. It's exciting to see all the new ideas coming out of the data analytics side of the ecosystem!