Bitcoin: Is It A Head And Shoulders Pattern???
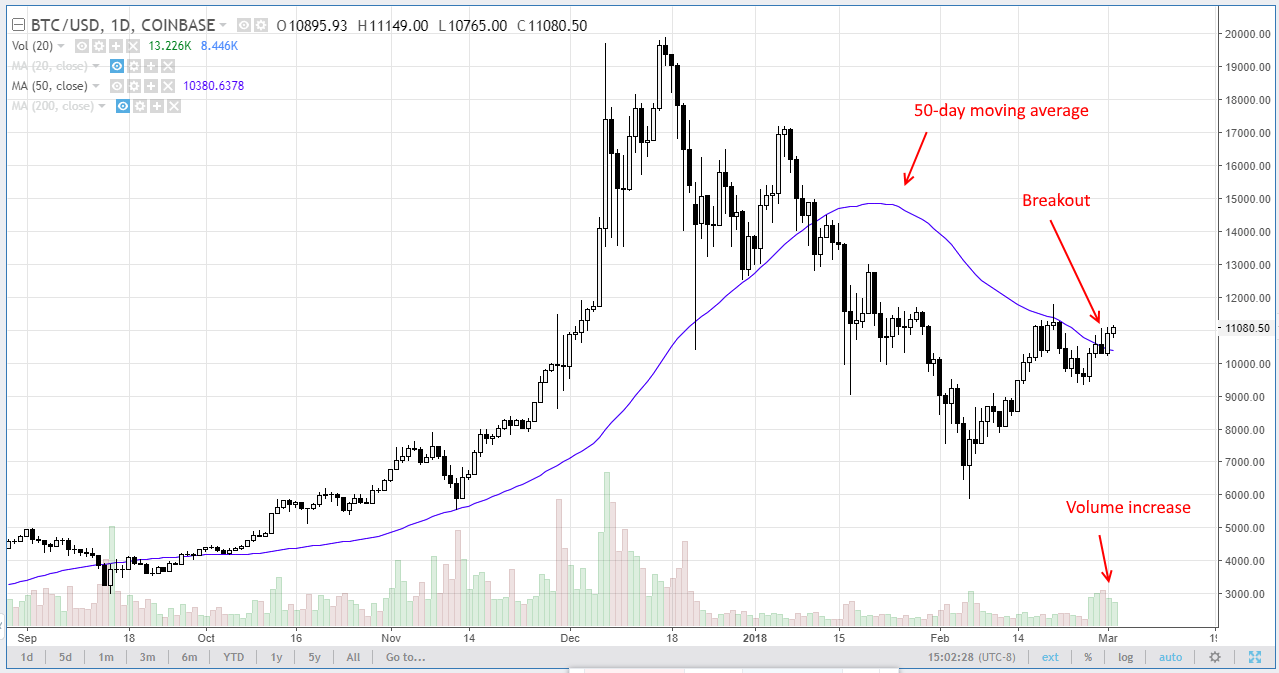
As you can see on the daily chart below, Bitcoin finally took out the declining 50-day moving average Thursday.
This is something I have been wondering: Is Bitcoin forming a bullish head and shoulders pattern? Let me show you.
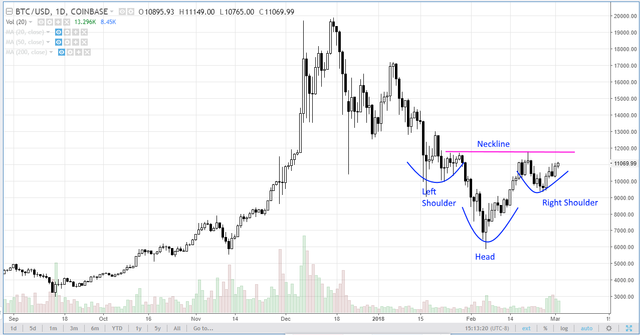
Currently, Bitcoin is forming the right shoulder. The neckline runs near 11700, and a buy signal will be flashing if Bitcoin moves above the neckline. If that happens, Bitcoin may go up as high as 17200.
Hopefully seeing 17k again soon!
I'm not convinced this is a bullish pattern just yet, as the volume has been diverging (albeit in the short term) from the price action, leading me to believe that its not a genuine upswing.
What sort of probability do you think exists that BTC will retest 7.5-8k? I think 50% likely...
As you can see, Bitcoin moved above the declining trendline(A). As noted by 1 and 2, Bitcoin formed a higher low. If Bitcoin takes out #3 high, it will confirm the uptrend. At this point, all I can say is Bitcoin is trying to get back to the uptrend. In other words, Bitcoin is not completely out of the woods yet. I don't know BTC will retest 8K, but if it fails to take out #3 high, we may see BTC to go back near #2 low(9300).