Bitcoin Technical Analysis - Too Early To Rally?
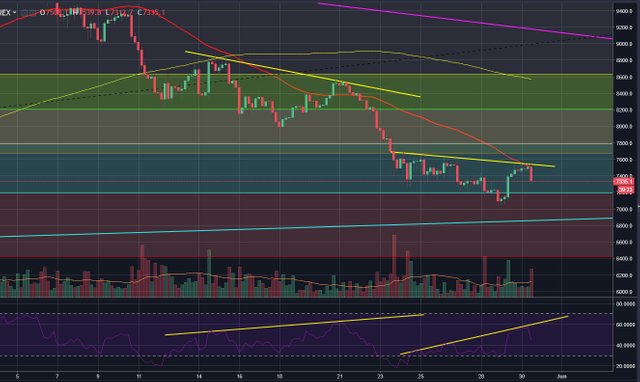
In my previous analysis I presented an RSI divergence that could signal a reversal in Bitcoin, although I was doubtful of that scenario. Bitcoin did recover 5% but if my interpretation of the charts is correct, it would be better for everyone to re-cork their champagne bottles for now.
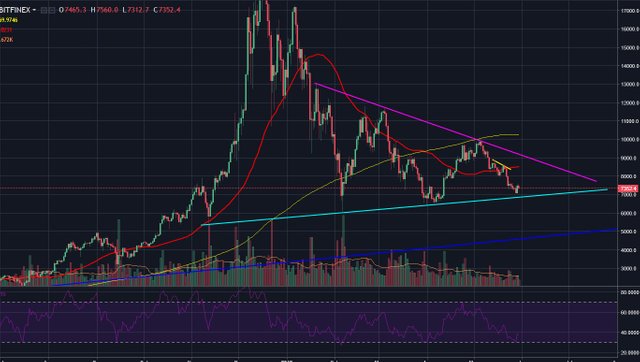
The RSI divergence from the past few days looks very similar to the one Bitcoin had from 14th to 21st of May, after which BTC fell about 16% in three days. I'm still expecting a fall to the baby blue trendline which is now at 6850 usd.
Looking at the daily chart I feel like this would be a handsome buying opportunity. Bitcoin hit a strong RSI support while making the recent lows. The ideal scenario from a buyer's perspective would be to touch the baby blue trendline while simultaneously hitting the same RSI support. That very nearly happened. In fact, looking at the daily chart, one could say we went down far enough.
It's worth noting that waiting for the ideal scenario can often leave you out, and it's instead better to ladder your buys. While I personally want the price to still fall a bit before starting a major bull run, it's entirely possible that we may never see Bitcoin as cheap as we saw it yesterday. That's why I have bought around 7200, and I will buy more if Bitcoin goes lower.
But...Do your own research and don't trust what every idiot on the internet tells you.

