Bitcoin - Simple Technical Analysis
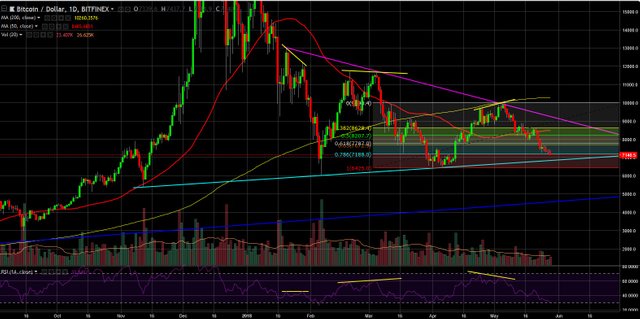
The 0.786 fibonacci level seems to be breaking at this very moment, which would mean that BTC is looking for the next support at the baby blue trendline you see in the picture. Right now that line is at about 6850 usd. We are starting to fall to those support levels that were formed in February and April. As long as we don't make new lows for the year, there's no need to start jumping off bridges.
That's a nice-looking wedge. Would be shame to break it now.
Daily chart

I've drawn a few divergences in the RSI. When you see the RSI (or other indicators like MACD) diverging from the actual price action, a shift in momentum could be coming. I just like to use it as a confirmation. We had RSI divergence in May when this last downtrend started. But if you keep looking at the daily chart, you can see that the RSI follows the price very closely. So just going by that we could still have some room to fall.
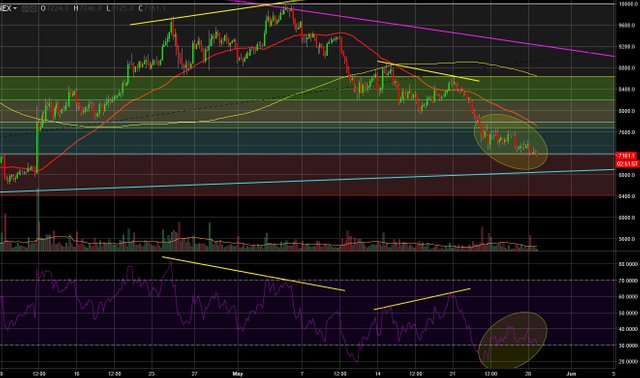
4-hour chart

You can see plenty of divergence diving into the smaller time frames. Could this last divergence coupled with the 0.786 fib level start a new rise? Doubtful. I'm keeping my eye on the baby blue line and buying when we get there.