Up we go?
Looking like a reversal in the making on the chart...
The 1H chart looks like we might see a reversal on the BTC chart...
We have a reversal candle (as I call them) at support:
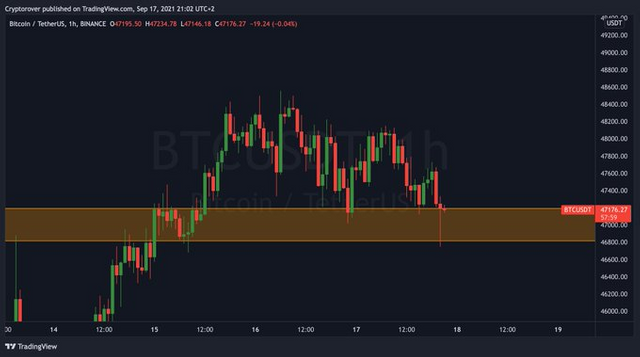
(Source: https://twitter.com/rovercrc/status/1438941800165687307/photo/1)
There are no guarantees on these shorter term time frames, but it has a decent setup.
Needs to break that downtrend of lower highs before I get too excited though.
I never look at 1H chart... I usually watch 1 week chart or 6 month chart... Like I said earlier, we can't compare Bitcoin's current situation with any previous patterns as the conditions currently are unpredictable.