Technical analysis Bitcoin BTC/USD - 07.01.2018
It's been a long time since our last analysis. It was caused by the Christmas break and the break connected with the celebration of the new year 2018. We realize how important it is for you to observe and analyze the situation on the cryptocurrency market, but you should approach this topic in a healthy way, so as not to detach yourself from important moments in your life just to look at the charts every now and then. Most, especially less experienced investors, think that higher intensity, or more transactions and longer time spent analyzing charts, leads to higher profits. Nevertheless, we are back with our standard analyzes starting the first analysis this year from Bitcoin.
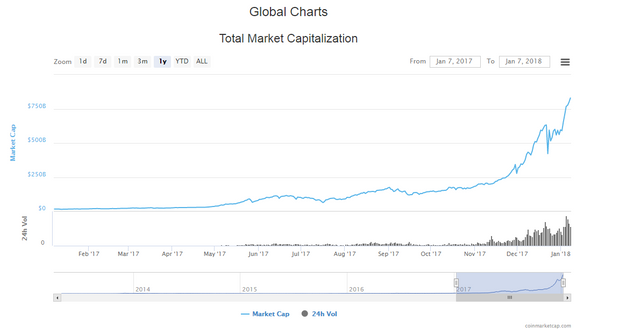
The capitalization of the entire cryptocurrency market is already over USD 830 billion. We remind you that it was less than 17 billion dollars a year ago.
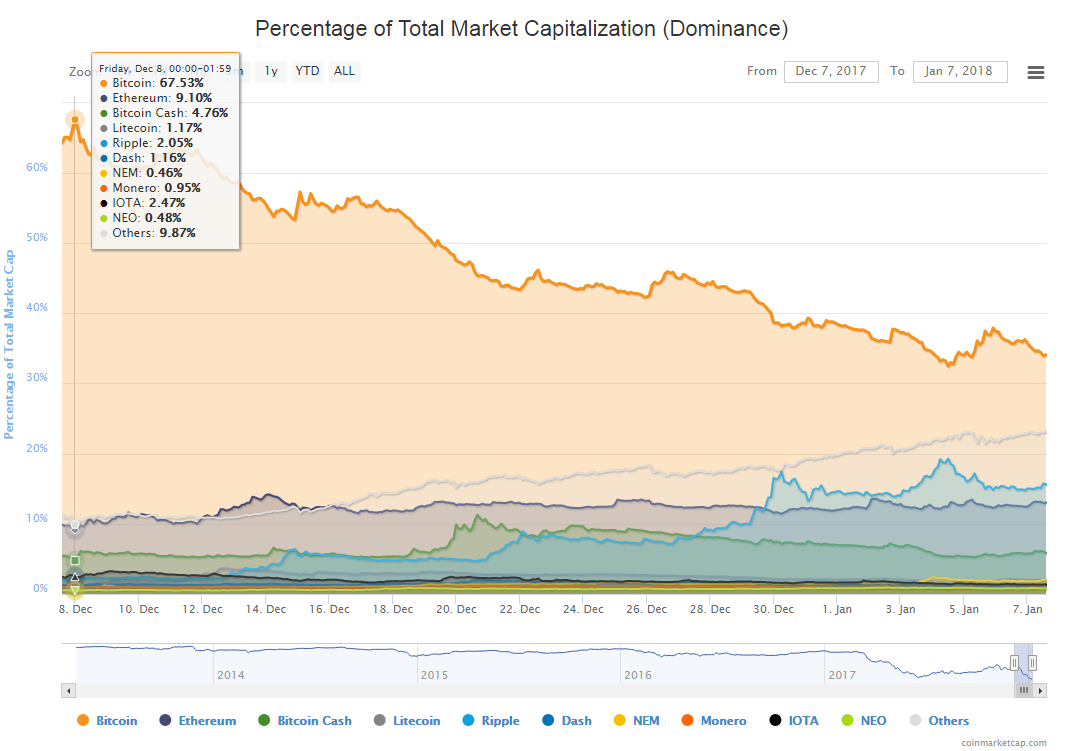
At the moment, Bitcoin's dominance is only 33.8%. This is a fairly poor result. A month ago it was 67.5%. The Btc price in the last 24 hours has been down 1.7%. In the second place in the cryptocurrency ranking is Ripple, followed by Ethereum. Both cryptocurrencies increase over 7% in the last day.
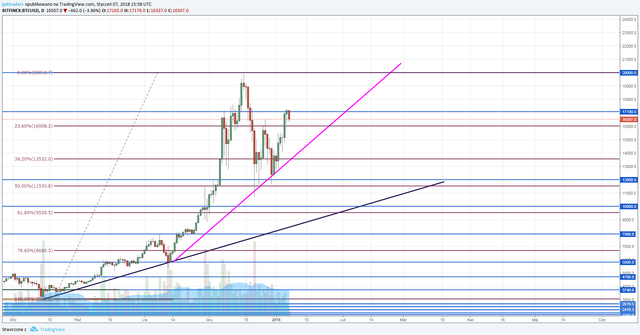
From a technical point of view, on the BTC chart we were dealing with a price correction reaching 50% of the Fibo abolition of the growth impulse marked on the chart below. The price tested this level 2 times creating a double bottom structure. These were around $ 12,000.
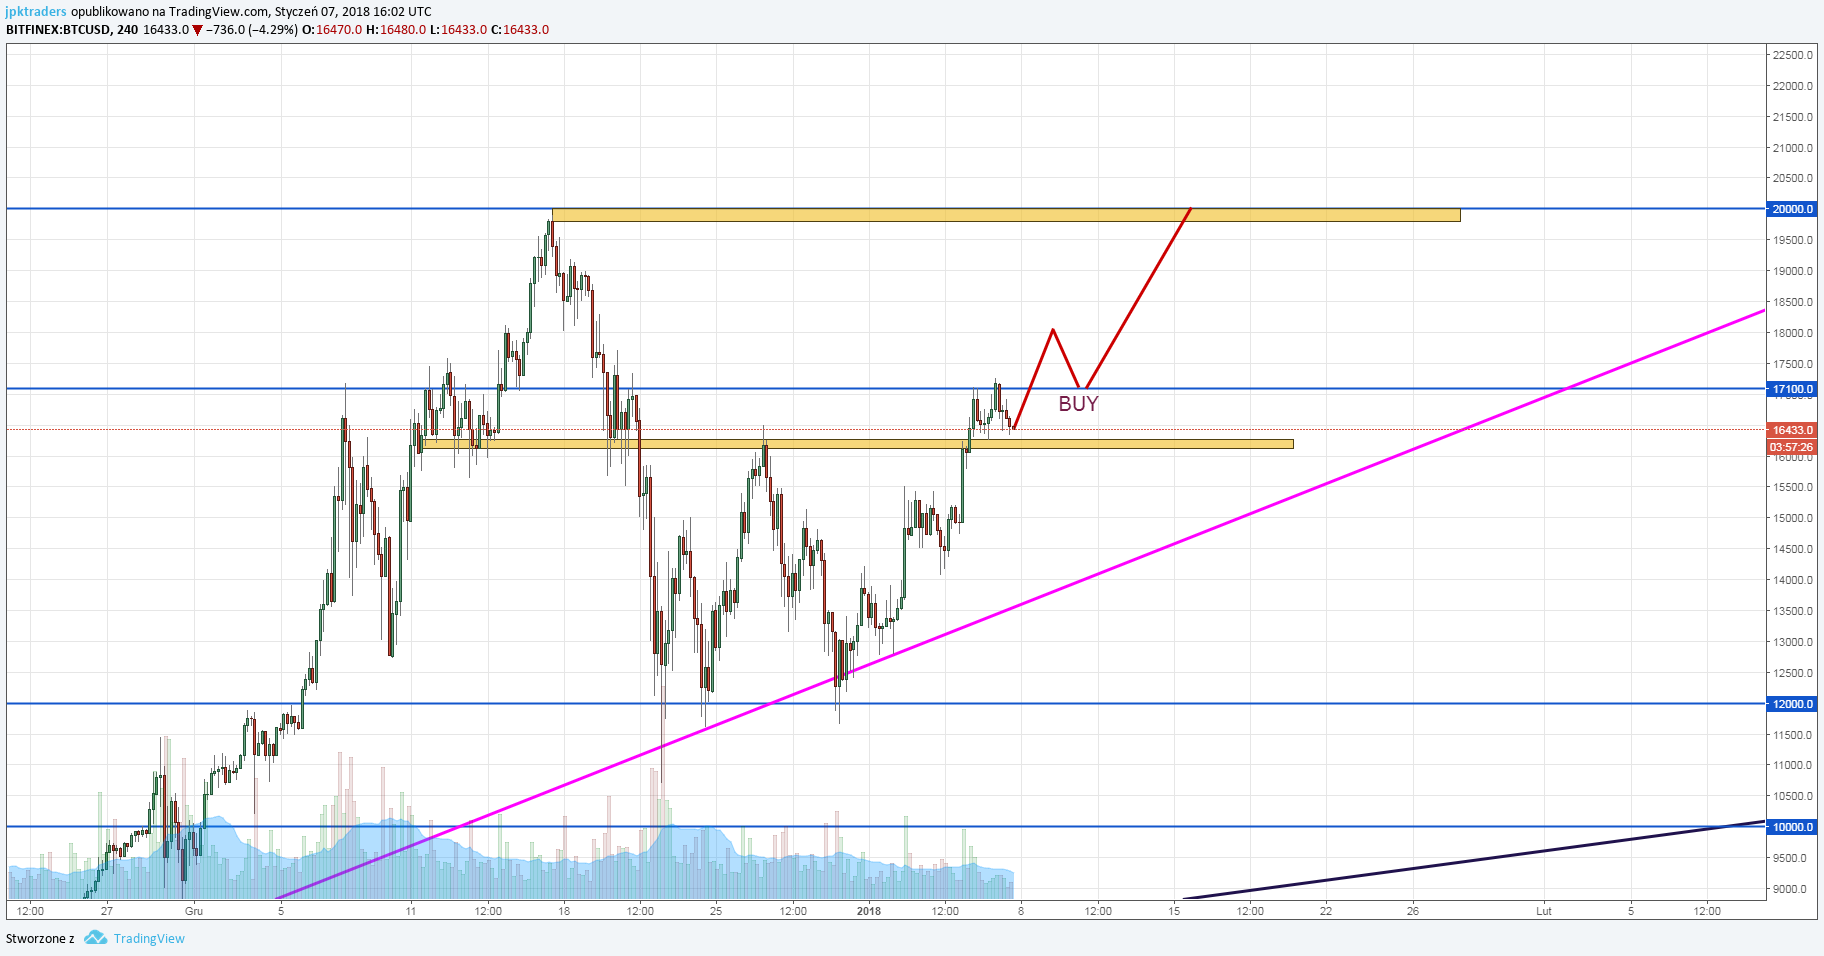
Going to a lower time interval, we see that the next barrier to further increases is 17,100 USD. After breaking it on top and test, you will be able to look for a place to buy. The first TP will be $ 20,000.
On the daily chart, you can still see the growing trend, therefore we deliberately do not set a place to take a short position. Trend is your friend.