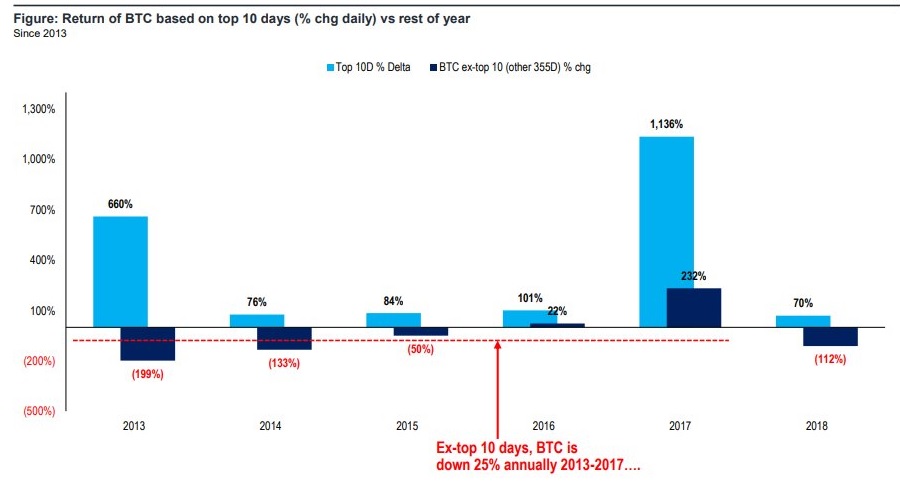
The Magical 10 days vs rest of the year
Let's select the best 10 days per year, when Bitcoin gained the most. Compare the gains with the rest of the year, with the other 355 days.
Be sure to click on the image to view full screen!
In 2013, the top 10 days (%chg daily) gains were +660%, while the other 355 days saw a negative return.
In 2014, the top 10 days (%chg daily) gains were +76%, while the other 355 days saw a negative return.
In 2015, the top 10 days (%chg daily) gains were +84%, while the other 355 days saw a negative return.
In 2016, the top 10 days (%chg daily) gains were +101%, while the other 355 days saw 22% return.
In 2017, the top 10 days (%chg daily) gains were +1136%, while the other 355 days saw 232% return.
In 2018, the top 10 days (%chg daily) so far +70%, while the other days saw a negative return.
Highlighting that without the 10 best days, BTC annual return is -25%.
It is like fishing. You have to sit and wait for long enough the catch one. If are not patient for long enough (in average 36.5 days), you will not gain that much!
Examples from this year:
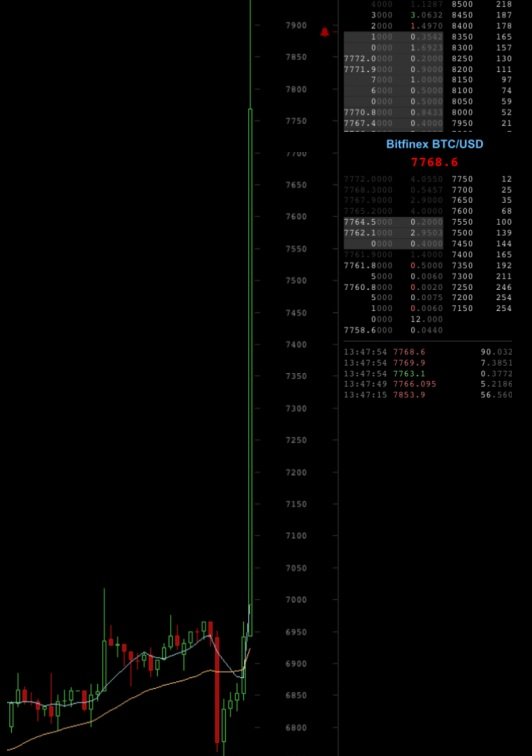
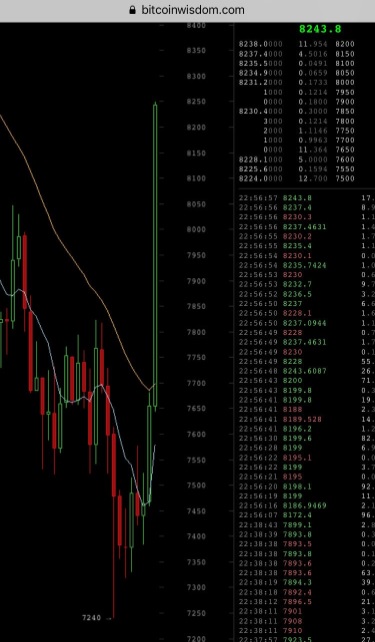
8 more $1000 candles like these, and we are good for this year!
Data source : Fundstrat
I still believe this is a bounce as I have been saying, i think those big ten days will be in the latter half of those years
Well researched... Nice one friend