Sideways Market, not looking good
BTC's staying choppily sideways and will possibly fall more... has been in a triangle and broke a bit but is falling back, crawling along the green line of the Gann fan, and now downwards again along the downtrend line - the same action I watched a few days ago before it fell straight down to the 9k low.
So I would say caution is a good idea, and yes I HOPE it will fall straight to 8k so the damn indecision will be over. Because lets be honest, that's what we've all been waiting for.
ETH doesn't look at all better. This is a risk-affine day trader's market. Ripple looks very prospective as it took the biggest losses... We need one lower low, hopefully THE all-time-low of the year ?
I'm also waiting for a 7-8k dip. I almost FOMO'ed in yesteday at 12.8k since that almost kinda negated the EW ABC correction from 19k.
I was there looking the entire time when it dipped to 9k and didn't take advantage of that opportunity.
Not sure if I read you wrong but afaik it was not the ABC that was negated but the wave 3 of C count. For some reason lots of people are calling the awkward five wave count to 9200 as the potential bottom C when there is a much simpler explanation. 3 needs to drop below 9200 prior to putting in 4.
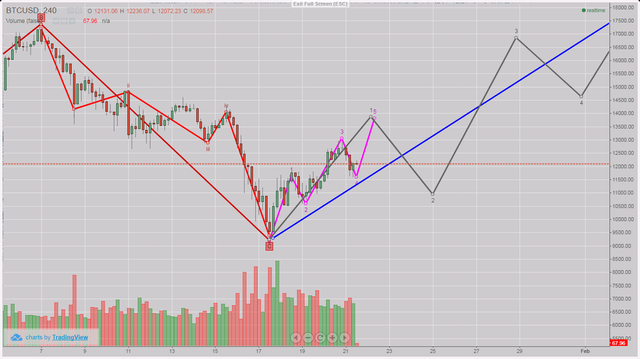
Illustrative only. scribbles, no price targets.Wave 3 target = 1.6 of 1 here so it does fit technically
Just dumped 4 and 5 on the channel.
That's why I didn't FOMO in. Too many possibilities now ...I literally have now idea which way will the price go short term. I am inclined to believe (just a little bit , NOT SURE) that we are going to enter the Capitulation phase pretty soon if the price doesn't go above 14k.
However looking at your chart ...could you show me how you read subwaves of wave 3 ? :)
Cause if you think we just started subwave 3 of wave 3 ......then wave 3 is going to be a big ass wave down.
Yes totally agree, the possibilities are myriad and we just have to discount the options as the price evolves.
I tried making a chart to illustrate how I think the chart might count but realised that wave A in this correction is the perfect example of why it looks awkward.
Wave A has a messy count with a 1-4 overlap that needs to be skipped and I'd expect to see the same form develop again.
Please understand I am a rank amateur at this and do it for the fascination, learning and experience. Frog-odds sake don't trade my TA!
You don't necessarily count the whole spike up or down, as it could be one
sale or buy doing it. We are looking for the overall market sentiment, not the lone panic or fomo trader. So moving your wave 1 a little bit up is not really bad. Then this count is valid.
I did this in the post Will BITCOIN continue the PARABOLIC TREND? Up, up and.. as my primary count, but just now it seems a bit too bearish, this might either not hold true, and the pink wave up may be an abc correction in the 5 wave down.
The only way to learn this properly is to study, practice and put your charts in the crowd to get rect or praised, again and again :)
Right, this is something that has been bothering me and where long term charting experience is missing.
For Alts with wild spiky charts I tend to go with the candle bodies and ignore the wicks. For BTC on a big exchange I try to stay true to the extremes for Elliot and knock them out for triangles and trend-lines. I'm guessing experience on each asset will improve judgement there.
I would comment on your chart though that the aesthetic form of the 5 wave impulse just does not present well and leads me to look for a better looking solution. I guess time will tell.
The aesthetic form is just as much shaped by time as price, and I don't predict time :)
You have wave 3 as shortest price travel.
That doesn't make your bullish impulse wrong of course, just makes me question the completion of the overall form. It seems to be a really awkward count. But I'm convinced we will look back on this and see it clearly for what it is.
Realised I put the 2 in the wrong place in the first big picture chart . needs to be one minor peak to the left. The count will then make sense. Thanks for the vote :)
FWIW I watched the touch at 9200 150 day EMA and didn't feel it had quite done the job yet either.
I look at EWs a lot when they can be easily discerned, and that's often possible even on the 1 minute scale. But sometimes EWs are not ideal, there will be interruptions in waves, there will be crippled ones, and to try and still count them as valid while refusing to use other methods and general market mood is a bit autistic and sometimes bizarre.
So I use a mix of Fibonacci, Gann and trend line, and comparison with what happened in a similar wave pattern maybe a year ago. It's enlightening what limits and patterns crypto price development follows once you try all of these, and just keep the ones that work in a special situation.
Haejin just uploadad his morning update and he's haaving the same wet dream we're having ;)
Agree. At times like this you gotta dig to the bottom of the tool box. Find you might not have the right spanner and figure on a new tool or getting creative.
i bought and sold a few times, it didn't make a lot of sense but Kraken don't charge anything right now to make amends for the 3 day downtime last week ;)
My worst fear is that this keeps wobbling on for another month. Not likely.
Did u trade BTC or other alts?
I've noticed the last few days it's worth more trading some alts on the USDT pair while mostly ignoring their charts. TA on BTC chart ...but when you want to go in buy ADA/XRP/XVG etc ...they go up and down much more % than BTC.
I had some Lumens left and I need to turn them into BTC before I can go into fiat, that's sort of clumsy and hard to estimate, choosing the best moment.
So in the end, you just do it... then I played around with BTC on the one-minute chart, but that's really boring after two hours or so ;)
You're correct about the alts in general. I'm really looking hard at Ripple right now, I just want the general irritation about Bitcoin out of the way.
Yeah I’m actually really hoping to drops to $8k so we can move on with our lives, I’ve been obsessing on what to do for the past few days lol. It would be great too because it would definitely bring the bull market back and hopefully to another ATH
Get on with our lives, exactly...
I'm with you; I was actually disappointed when BTC bottomed out at just below 10K. I had my finger on the buy button @ 8K, and was thinking that maybe it should have dropped to 7k.
This volatility doesn't bother me at all, because it is not indicative of value. These prices are driven by speculation, and not actual value. CryptoC value has remained the same. The question for the long term investor (I'm not a good day trader) needs to ask is whether or not the value is going to increase over the long term, which it is.
Another important question is when (and if) the alt coins are going to break free from "mamma BTC", and hold their own value based on their own merit.
I think alts will be more and more free, but the entire market will always much react as one - all markets do, as the weirdos investing in them are always the same ;)
I've been thinking about this once again and tried a grander approach, that would see the entire wedge on a larger scale, lead us down to 7000+ and give us time to regroup and grow by early March.
That would mean we can have 2.5 months of an actual bear market, lower lows, the works - and only then, what with capital influx etc, start growing rapidly again... we'd have had our crash, everybody would be relaxed and happy. BTC would have fallen from about 19k to almost 7k, two thirds, who could ask for more.
Fresh bull market, all paranoia gone till... end of he year ?
The blue/greenish lower lines coming from the left to cut the upper triangle border near the possible breakout point have their origins at lows from July onwards through November... till mid February however, only day trading looks profitable.