You are viewing a single comment's thread from:
RE: Bitcoin (BTC) Evening: When is the Best Time to Buy?
I was thinking that's no longer relevant after we dropped straight past the right shoulder ?
I was thinking that's no longer relevant after we dropped straight past the right shoulder ?
This is where we sit at time of writing:
I added some more annotations to try and explain the patterns and calculations better.
I am looking for a bounce either here (at ~12k), or as @haejin points out, ~11k where there is more historical support.
Once that happens, I'd be looking for decreasing volume with increasing price to ~17k. Then increasing volume as price starts to decline again. If this happens, we are going to 6 - 7k where there is historical support.
If this plays out, the right shoulder will be known as a "dead cat bounce", and this will become a major correction.
I'm not sure how likely all of this is, but with the increase in dumb money and the added ability for wall st to short, this is starting to look more and more like a probability than a possibility.
Im looking forward to Haejin's take on this.
A wider view of why 6-7k:
Oh ! So you mean the right shoulder is yet to come ? Whoa yeah I'm all for it :))
We just have to be aware, and waiting for it... haejin was not the only one to predict 11k, I read another analysis coming to the same conclusion for general symmetry reasons rather than h-a-s. You gotta be cool on Wall Street¸¸.•¨•♫♪ ;))
TY for making me aware.
Yes, exactly.
Haejin mentioned the potential for the smaller H&S (the one in yellow above) yesterday, and as soon as he said that, it become clear to me there was a bigger H&S (the one in green above), which is a fractal, potentially in play.
It's always better to be prepared with potential outcomes than to have them sprung on you without knowing how to react.
Good luck!
I have trouble identifying these structures because my screen is so tiny, it all looks rather blocky... I'm now running two browsers so i can use two tradingview accounts, one with a 15 minute and one with a daily/4h hour scale, that works way better than switching time scale all the time... still, the HS scenario seems to be less likely now because of the lack of volume in the center - so maybe we can relax... keep up the good work, we'll soon have a team of experts ;))
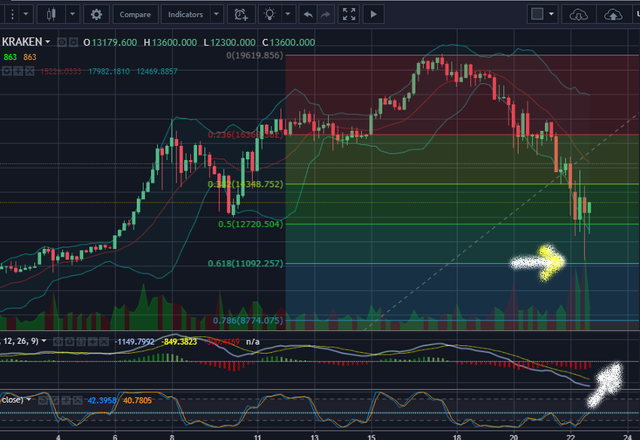
Here's a simple Fibonacci application, and it shows that the deepest dip (at Kraken) went right to the .0618, which makes it a perfect moderate retracement so far.
Although @haejin may be correct that this wont end up forming a H&S, I believe he was incorrect about the H&S volume:
http://stockcharts.com/school/doku.php?id=chart_school:chart_analysis:chart_patterns:head_and_shoulders_top_reversal
This is with the caveat that Haejin has much more experience than I do, so he may disagree with this assessment. I guess only time will tell, but it's good to have it in our bag if we need it.
Shorting is not yet available on the futures contracts
I thought it was, but only with significant margin: https://www.marketwatch.com/story/interactive-brokers-says-its-will-now-accept-bets-that-bitcoin-will-tumble-2017-12-13
If you have different info I'd love to see it.
Either way, as @haejin pointed out, it's somewhat irrelevant because these things often become post hoc justifications for price.
I think it's worth understanding the implication of shorting in the market though, since in the past, it was a very one sided market.
Also: https://www.ft.com/content/a72a61dc-e6f2-11e7-8b99-0191e45377ec