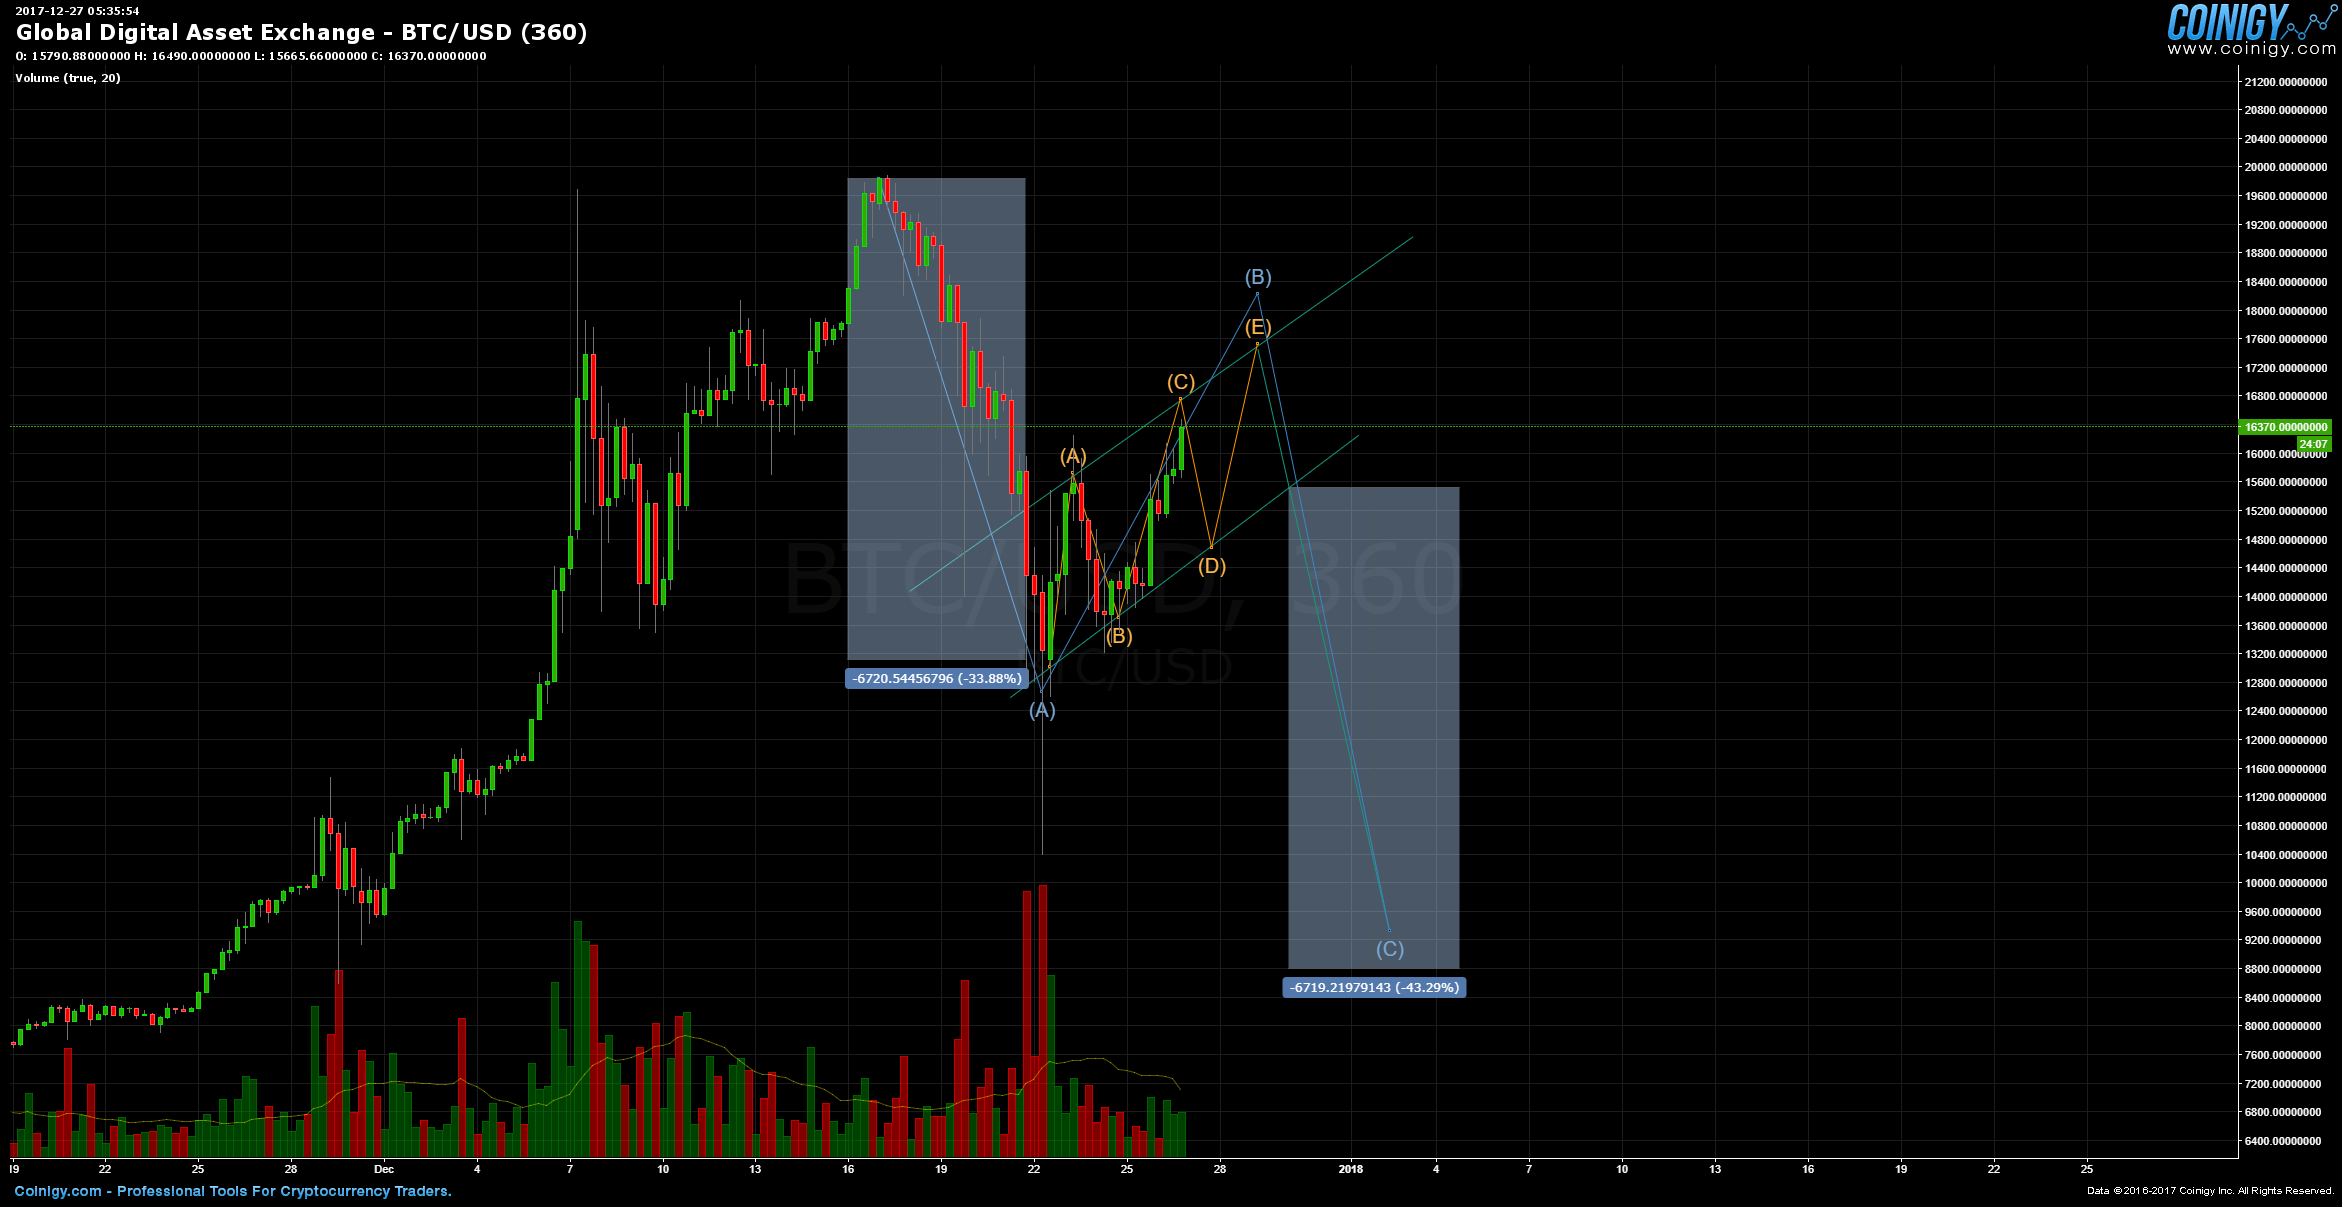
Possible Bitcoin Bear Flag Forming
Bitcoin could be forming a possible bearish flag. A flag pattern indicates a period of price consolidation before continuing a larger trend upward (bullish) or downward (bearish). In other words, the price is taking a little bit of a break before the next big selloff. If this pattern holds, price could dip below $9000.
Note the ABCDE points are there as a guide. Flag patterns do not need to touch the support or resistance lines exactly nor are they required to have five "waves" as shown in the chart. All we need is for the price to remain within the trend lines in a direction opposite the main trend (downward in this case) until it breaks downward to continue the downward trend.
How did I determine the $9000 price target?
To extrapolate flag patterns we measure the length of the 'pole'. The 'pole' (leftmost box on the chart) is measured from the start of the price trend (Bitcoin's all-time high in this case) to the point the trend reverses sharply (the 'A' point on the chart). I'll use that as the minimum price target after the price breaks down and out of the flag pattern's bottom support line and resumes the overall downward trend.
What if you're wrong?
If I'm wrong, price will break out of the topmost resistance line on the chart. Look for a good amount of volume on the breakout to confirm the flag pattern has been invalidated.
