RE: Bitcoin (BTC) Evening Update: Alternate Counts
@haejin I follow the Bitfinex chart for BTC, and the slight differences between Bitstamp (as you have posted recently) and Bitfinex make very subtle differences at critical points.
Please look at the charts below. Large view Bitfinex so you can see where I've placed my lines, and closer view.
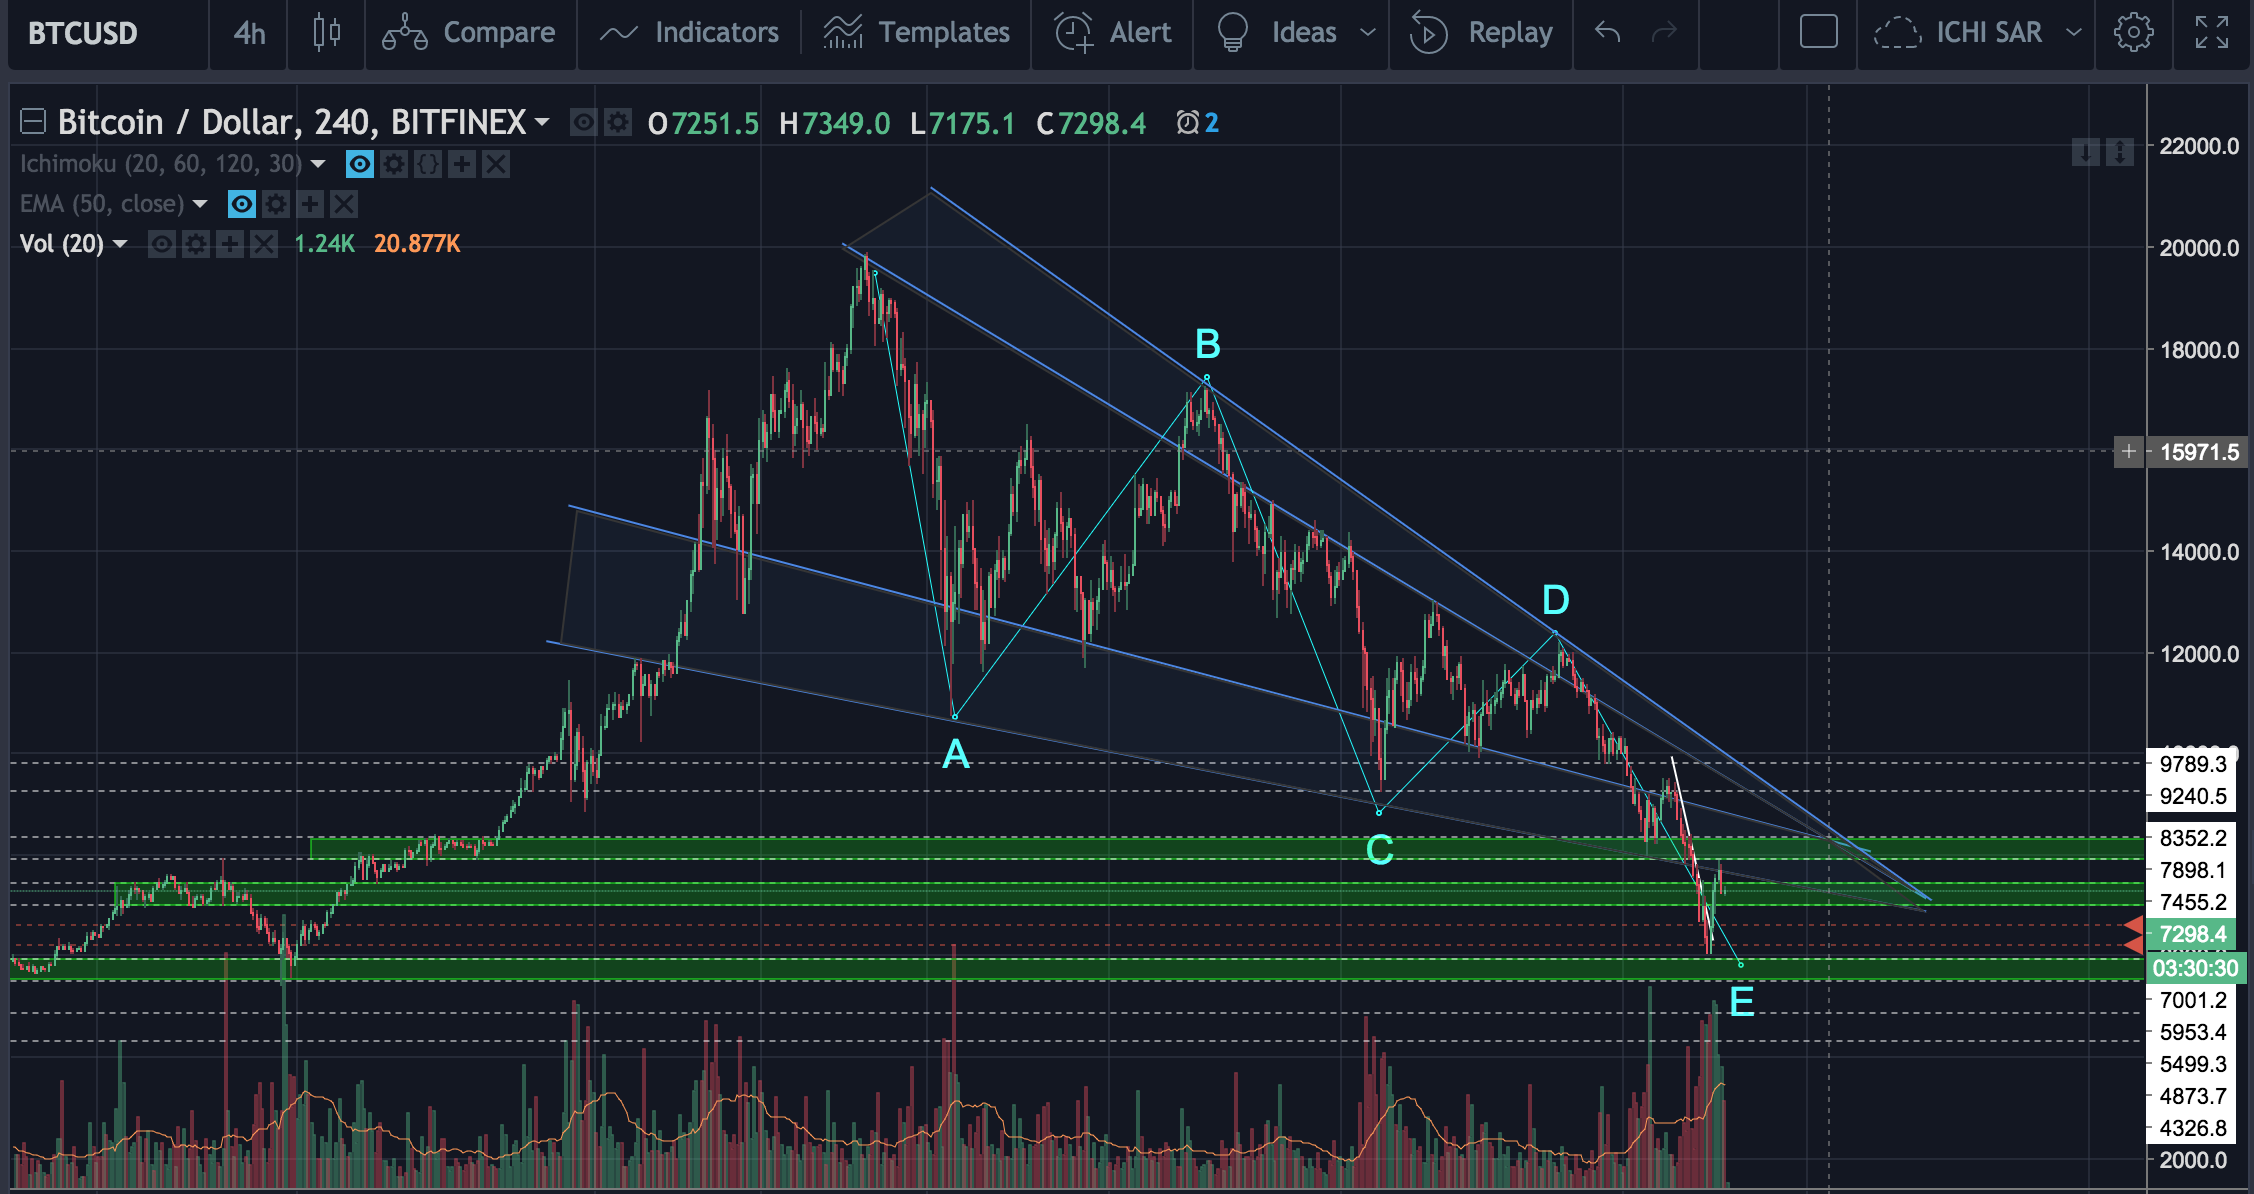
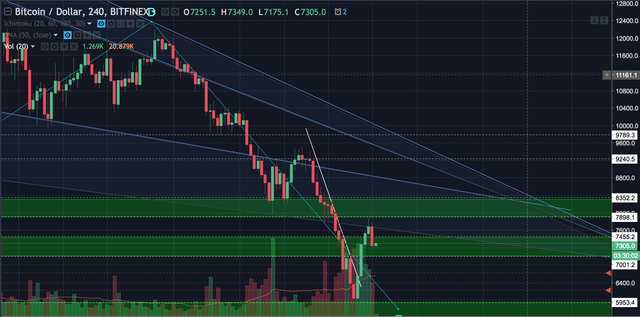
On my chart, BTC did not reenter the triangle, but instead touched it, wicked, and bounced.
Given that Bitfinex has more BTC volume, should we not chart BF charts? I say this with respect to your work and analyses, and in the interest of reading the most relevant charts.
What do you think? First of all, are my lines correct in the first place?
Thank you for everything you do to teach us your style of analysis. Personally, I could care less if you are right or wrong. I don't see it that way. I see your analysis is extremely useful. In recent times I've cross checked it with other forms of TA too, but ultimately, I use Elliott waves because I feel they are more reliable.
Don't ever let the turkeys get you down. I'm staying, regardless of the good, the bad or the ugly.
You've helped me not only to help myself, to think for myself, and to relax, but also for me to help my friends and family that are coming into crypto.
I teach them EW counts, pattern recognition, laddering and patience.
For example, my friend who just started wanted to buy Dragon chain at $2.30. It started going up. He wanted to FOMO so bad. I taught him to wait. Then came $2. He said "Now?", I said wait. Then came $1.80. "Now?", I said wait, you might get $1.50. Then came $1.50 and he said "surely now!", I said, actually, I think you might get it at $1.
and he did...
All the while, I showed him why, and how I was looking at the charts etc.
Thank you. These are skills you've given me. I'm teaching him from the basics that I have gained from you so far.
btc go to 10000 dollars in 2 day
yeah its epic pullback and hammer low at 6k.
now wait for buying under 6k. for now this shit is bullish.
soon the 8k sellers buy back in... fomo yeah
@haejin and @jdog - My chart for BITSTAMP and COINBASE show the price this morning to be well inside the pattern again at about 8,100 plus as of this post.
A few points to consider that may apply here.
I could not find similar examples for the downward wedge but I am assuming similar guidelines may apply.
My point is that with the current price rising fast, huge daily volume, and a probably breakout around 75% of the pattern instead of at the very apex may be a good thing. Especially if this is an inverted head and shoulders completes too. Maybe we are making the final turn?
Just another opinion to consider......
I'm looking out for the inverted H&S too. It will be very interesting and could fit the EW count well.
Wow. Any advice?
Now this haejin is drawing arrows down again. Last time he was drawing arrows up. Its just all nonsence for me. I got different strategy. And When i look at the chart this 6k was bottom for now. We go back up. At least 9k then 10k and then we will see if we can breakout resistance.
Free Crypto Fundamental Analysis Videos! https://steemit.com/bitcoin/@investingtips/free-crypto-fundamental-analysis-videos
bictoin will reach 10000$ this week and 30000$ in 2 months.