Bitcoin's striking fractal. Will it turn bullish on this one?
I am trying to compare two sequences.
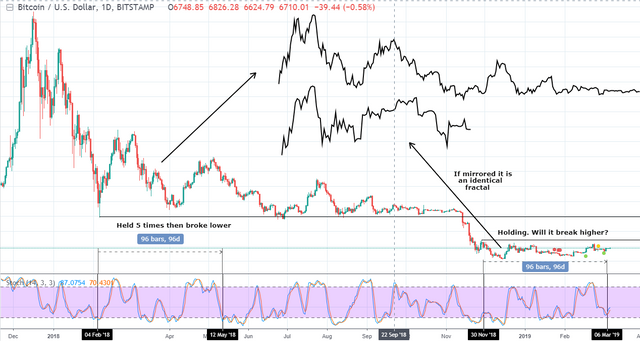
The first from February 6th to November 13th 2018. The pattern was Lower Highs (if you remember each high was on 0.618 Fibonacci from the previous one) and the 5800 - 5900 level supported this consolidation until it violently broke down - 50%.
The second is the current pattern. Higher Lows from November 28th 2018 to today and the 4200 - 4400 level rejecting this consolidation. Will it follow the previous pattern and break higher.
If the second sequence is inversed/ mirrored you can clearly see it is almost the same fractal . The STOCH is also printing out a similar reading.
Just some food for thought. I would love to read your opinions.