You are viewing a single comment's thread from:
RE: THE BITCOIN BEAR MARKET is Upon Us
I personally wouldn't refer to it as a bear market until we get a close below all of these bullish trendlines, a healthy "confluence" of them at that.
I personally wouldn't refer to it as a bear market until we get a close below all of these bullish trendlines, a healthy "confluence" of them at that.
Hi Jaemsbrown (a great singer by the way!)
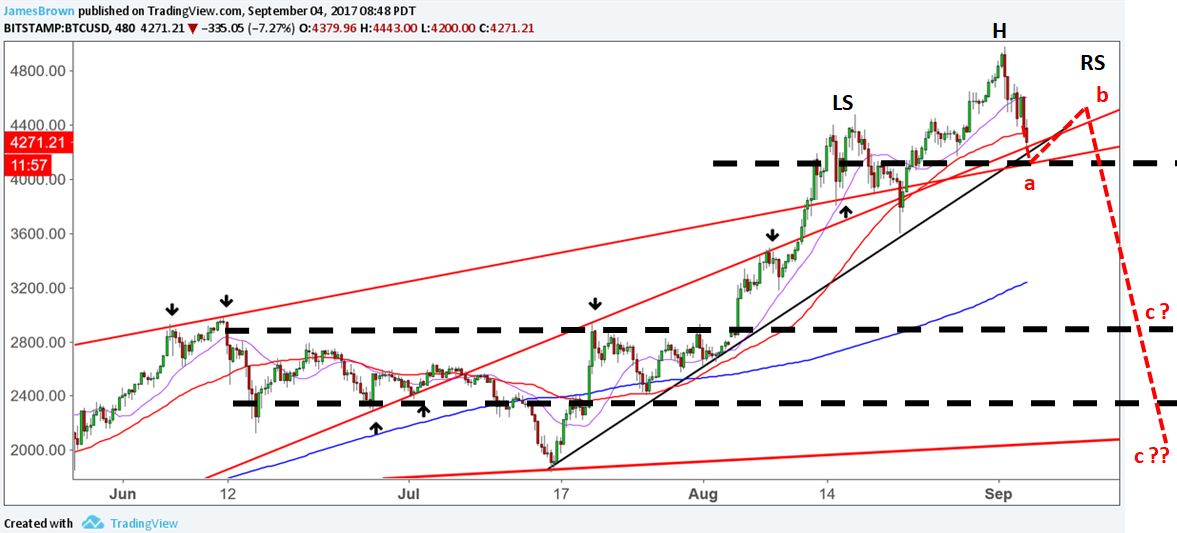
I agree with your support lines. For me, on a downtrend, I also use horizontal support lines. All dotted lines are my addition. I see three primary supports and for me these are more prominent than the slanted support lines. This because the slant support lines miss much of the horizontal support regions or only briefly touches them. I've also drawn my projections of a probable abc correction using these horizontal supports. The first possible stop for c is at around $3,175 as marked with (c?) and the second is $2,000 or so as marked with (c??). There could be a panic overshoot below the lowest dotted black support, but a brief one. I see this scenario as my probable and so primary count.
If there is a b wave bounce at the first dotted black support, this could result in a potential Head and Shoulders Top pattern as noted by LS (Left Shoulder) and Head (H) and Right Shoulder (RS) peaks. Note that your top most red line support would make a fine looking Neck Line to this H&S Top pattern.
possible. But time possible is not same as probable.
I don't have enough back-search data on this type of set-up to talk about probability here. All I know is that I wouldn't feel too comfortable shorting above this major confluence of uptrend lines, so I won't.
Nothing about that picture says bear-market to me. Looks more like a healthy (expected) correction in a bull market up to this point in time, although it did break a major support level on the 8-hour chart that I provided in the earlier comment, which is a bearish indication.