364 Days EMA Reveals the Secret.
90% of the Technical Analysis Professionals have left to tell you.
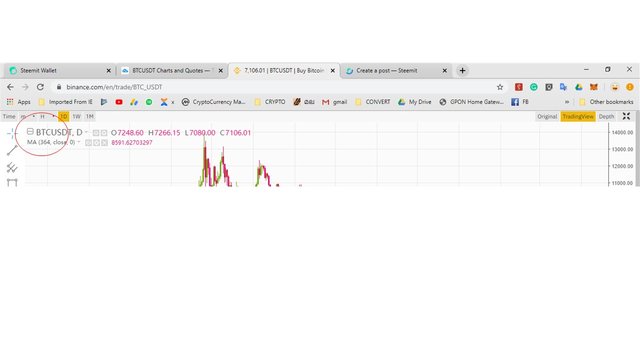
When I checked this #Bitcoin chart, why not make some changes to EMA?
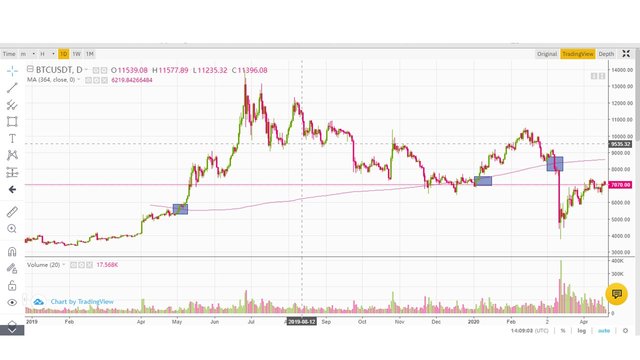
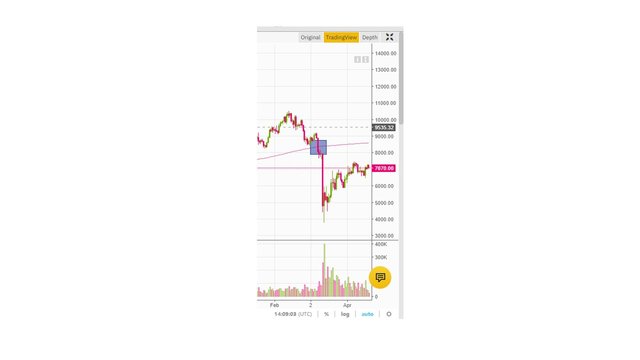
I took the BTC / USD chart and set it to EMA 364 in 1D time frame, which I later found to be quite eye-catching.
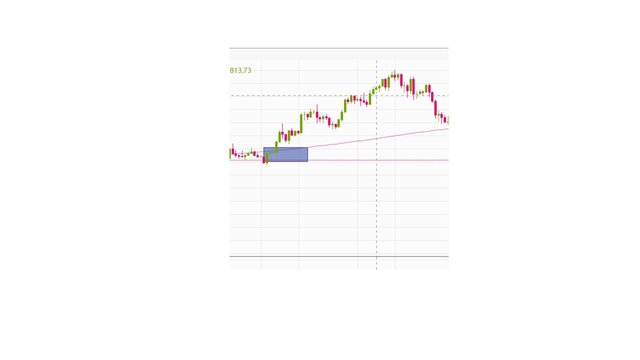
Every time the bar passes 364EMA, it breaks the 364EMA line and goes up. After a day's confirmation, the next move was extremely bullish.
Similarly, when the bar 364EMA crosses the line, it breaks the 364EMA line and gets a day's confirmation that the next move is extremely bearish.
What's next?
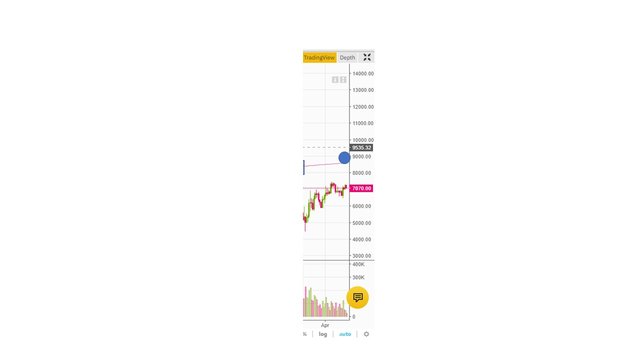
We are very impressed with the coming week. Going to test 364EMA.
Please comment if I am wrong.