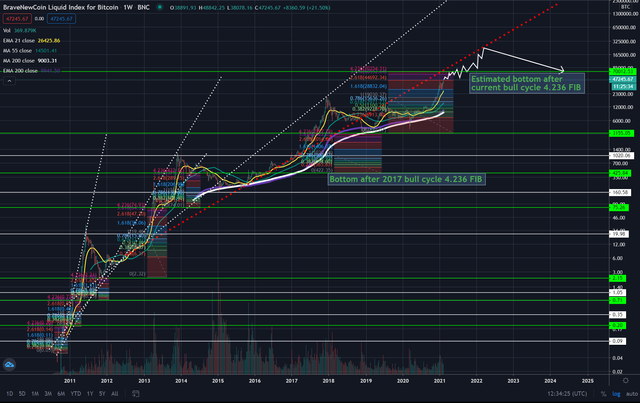
Bitcoin Chart Shows NEXT MACRO HIGHS & LOWS CYCLES!!
Interesting enough and based on the BLX historical data chart dating all the way back from 2010, we see that by simply taking a fib retracement extension every time bitcoin has put in a weekly uptrend and reversal cycle, the .4236 has proven to act as the low of the next bear cycle (green horizontal lines).
According to this and if history does indeed repeat itself once more, estimated retracement targets once this bull cycle ends should be somewhere just under $70K after a probable based -70% retracement after topping out at a $230K high.
View the full chart on Trading view below:
https://www.tradingview.com/chart/BLX/EQinK0wu-Bitcoin-high-and-lows-predictions-based-on-BLX-historical-data/
