My Trading Process, Step-By-Step!
In this post I wanted to give you guys a step-by-step run down of my trading process (and this applies to all market types not just bitcoin/ cryptocurrencies). I will use BTC/USD (Bitfinex) for this example. Let's get straight into it.
Step 1 - Decide on a number of different time frames that make sense for the particular financial asset that I am trading at this time:
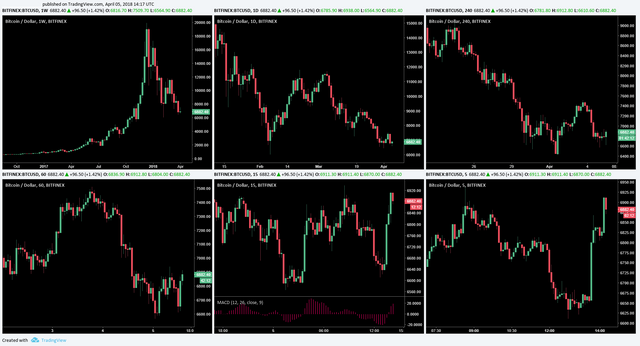
For BTC/USD I have decided that I want to look at 6 different time frames which are the Weekly, Daily, 4-Hourly, 1-Hourly, 15-Minutes and 5-Minutes time frames as you can see below:
I believe I can see everything I need to be aware of by looking at these time frames. I can see the overall trend, medium-term trends and short-term trends.
I personally believe without looking at the overall picture (higher time-frames) any trades that are made are basically gambles because you don't know if you are selling just above a long-term support that is holding well or buying just below a long-term resistance.
Note that I have included the MACD histogram indicator on the 15-minutes chart as I believe it is a good time-frame to watch for divergences in price vs momentum for the BTC/USD pair.
Step 2 - Analyse the highest time frame (weekly in this example) to see what kind of trend we are in overall:
I always take trades in the same direction as the overall trend because obviously the moves in the direction of the overall trend are stronger than the moves against it. You of course still need to be aware of whether the overall trend might be changing and adapt to the changing market environment.
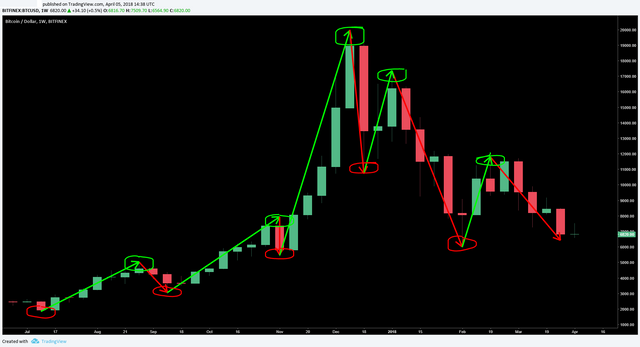
So what I basically do with the highest time-frame is I mark the up and down moves and the significant lows and highs like so:
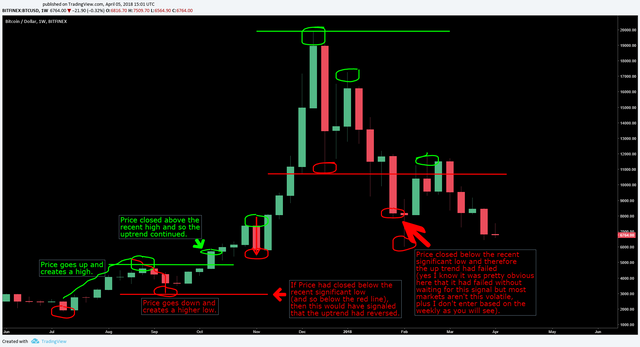
Why do I mark the lows and highs? Well in order for an up-trend to continue price must continue above the previous significant high and must NOT go below the previous significant low. For a down-trend to continue it is the opposite. On the other hand, for an uptrend to REVERSE, price must go below the previous significant low. I will try to illustrate what I mean in this image:
From the analysis of the weekly we can see that the up-trend has reversed and we are in an overall down-trend. We of course now need to ask ourselves when could this down-trend end? We will go to smaller time-frames to try to find this out.
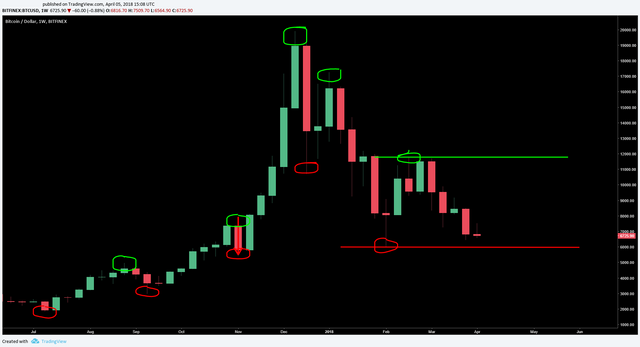
I will end my weekly analysis by placing two horizontal lines based on just the most recent significant high and significant low so that I know when price goes above or below these points:
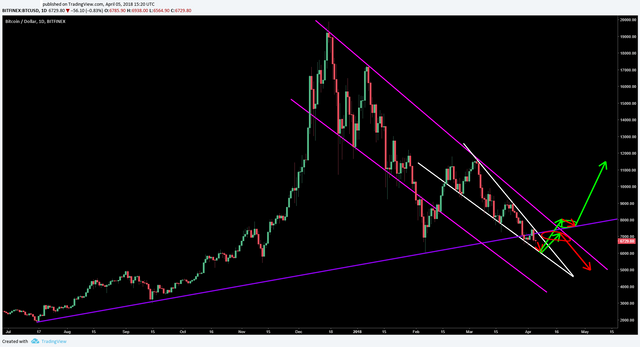
Step 3 - Analyse the second highest time-frame (the daily here) to find optimal trade entry areas:
Now I full-screen the daily chart and draw the strongest trend-lines and chart patterns that I can see to find the best possible areas to look to get into a trade. In this example I have drawn the down-trending channel trend lines in pink, the long-term support trendline in purple, and the falling wedge in white. I have also circled two areas, one in green where I see to be an optimal buy area and one in red where I see to be an optimal sell area:
Some of you might suggest that I am going to miss a lot of action waiting for Bitcoin to hit one of these areas (if it ever does hit one of these areas), but I believe that patience and waiting for the most optimal spot to buy/sell is a massive part of what makes a trader/investor profitable and successful long-term so I am willing to wait for the best opportunities only. To help with this you should of course be analyzing a number of different financial assets to ensure that you have opportunities regularly to trade.
After this I will go to the smaller time-frames to take a look at what price action does when these optimal buy/sell areas are hit. I am trying to find the most optimal entry and stop loss prices to get in to a trade at the beginning of the next big wave.
Step 4 - Analyze price action on smaller time frames to find optimal buy/sell prices, stop loss price and when to close the trade:
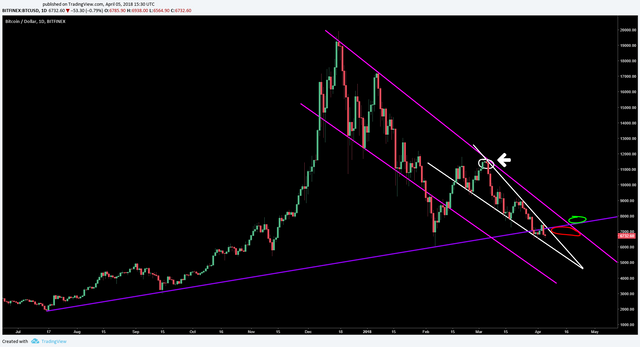
Obviously price hasn't hit the above highlighted areas yet and so to illustrate how my trading process is completed in full I will need to look back at a past trading setup. I will choose the time when we hit the overall falling trendline and rejected it for a third time, on the 5th of March, highlighted below by a white circle and white arrow:
So when price reached/ was close to this falling trendline I would have looked at smaller time frames to find an optimal time to short BTC/USD (keep in mind that price might not have rejected this falling trendline obviously and so I might not have gotten in a short at this area as price might have just blew through the falling trendline).
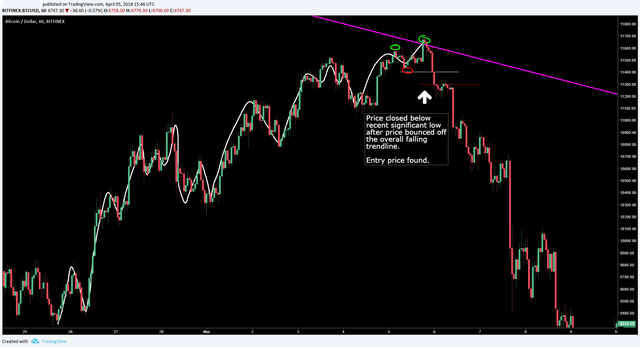
Here would be probably the best price to enter based on the 1-Hourly chart:
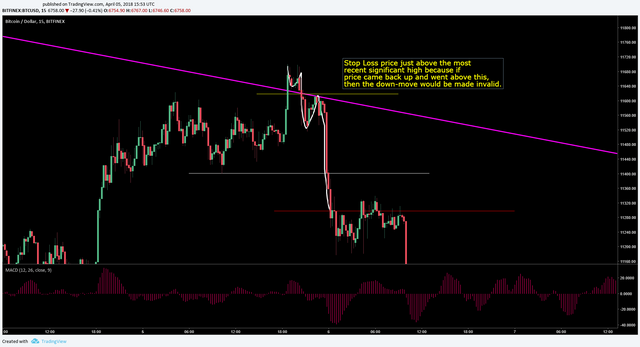
Then, we go to an even smaller time frame (the 15-Minutes chart) to find a stop loss price:
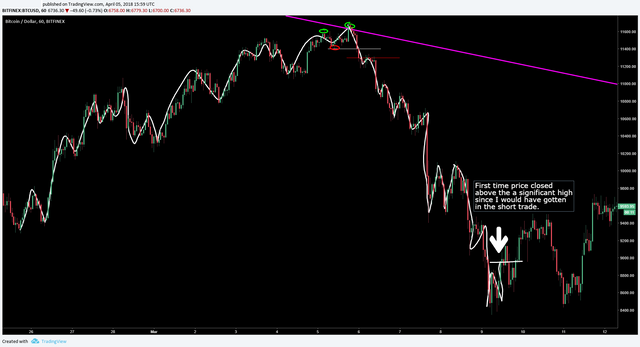
So at this point I would be in the trade. Now do I place an automatic profit level? No, I watch for price to move and close above a significant high on the 1-Hourly chart before I close the trade, because that tells me that the down-move may very well be over. Here is where I would have closed this particular short trade:
The reward:risk ratio on this particular trade would have been about 11:1 (minus fees) so I think you can see the power behind only trading the most optimal spots based on the higher time-frames and entering at the best time based on the shorter time-frames.
Well that was a step-by-step overview of my trading process, I hope you learned something from it and can take some stuff away from it to combine with your own trading methodology!
My last words will be to emphasize a few things:
- Always analyze multiple time frames, to see the big picture and the smaller pictures within the big picture.
- You want to short the reversal of an up trend or long the reversal of a downtrend, because you don't want to get in at the end of trends, you want to get in near the beginning and out at the end of course!
- An up trend continues simply when price closes above the most recent significant high or reverses when price closes below the most recent significant low.
- A downtrend, on the other hand, continues when price closes below the most recent significant low, or reverses when price closes above the most significant high.
Thank you for reading and have a wonderful day :)
Legal Disclaimer: This is just my analysis and not to be taken as professional financial advice. Do your own research beyond what you read in my blog posts and make your own decisions based on your beliefs about what to invest your money in.


Great trading process.
Thank you :)
Solid analysis.
Thank You :)
I am kind of new but I am surprised to see that my way is a bit similar to yours.
I choose a candle length of 1 day, 12hr, 3hr, 1 hr, and 5 min. After that my process is rudimentary but with pretty much the same principals as yours. Still your method seems better than mine.
Thanks.
no problem :)
Good afternoon. I have a request for you.Could you sign for me, and in return, I'll sign for you.
:)
what does "sign" mean exactly?