Daily and Weekly In-Depth BTC/USD Analysis (New Bull Trend or Bull Trap?)

Hey guys, in this post I am going to go into as much detail as possible about what the price action for BTC/USD could be telling us. Let's get straight into it!
Weekly Time Frame
Below we can see the Weekly XBT/USD BITMEX Chart:
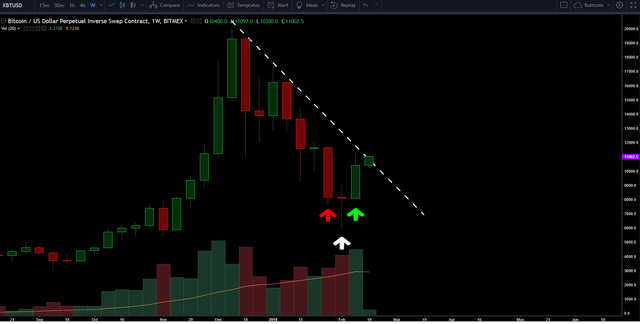
First of all we will take a look at the candle which the red arrow is point at. There are two things to note with this candle:
Long Bearish body with only small wicks. This tells us that the sellers were in almost complete control throughout that week and therefore it was a very bearish sign for the market.
However, while the Volume was above average, it should have had a lot more volume in my opinion if you compare it to the preceding candles which had smaller price ranges yet around the same volume. In short I would have expected a lot more volume with such a strong bearish candle.
The next candle, which has a white arrow pointing at it, again has two features I want to talk about:
Very small body with a lower wick which is about three times the size of the upper wick. This tells me that the previous selling pressure has been overpowered by the buyers enough to stabilize price. The small body indicates that the market was not willing to stay lower than the previous week and there is now more indecision about where price should be going than before, when it was clear price was heading down.
Volume was well above average and near the all-time-high for this period of time. This shows that there was increasing interest in where bitcoin price was going in relation to the USD. It also tells us that there is a lot of support at these price levels as a lot of that volume was buying pressure to pull the market back up from the 5.9k level to close just above $8,000.
At this point you would be waiting to see what the next candle looks like at the end of that week before you make any decisions about whether the market will continue down or reverse up.
The third and final candle is highlighted by a green arrow. Again we have two points to talk about; the candle and the volume associated with this candle:
The body is a fairly strong bullish body but has a decent size upper wick and no lower wick. The strong body of course is a sign that price is reversing, however the upper wick suggests that not everyone is convinced of this reversal yet and so there is still a decent amount of resistance and selling left in the BTC/USD market.
The volume is again higher and coupled with the strong bullish body certainly indicates a weekly reversal may be panning out. Once the last of the selling/ doubters of the bull trend can be overcome and converted to see this as a reversal of the trend, then we could be heading back to all-time-highs again fairly soon, in my opinion.
That is my explanation of the three most recent candles that have closed, I have not commented on the current candle because of course it has only just opened and so doesn't really tell us much. The only thing I would like to point out is that price is now testing that sloping down trend line currently and if this week's candle can close convincingly above this trendline and with high volume then I would be much more confident that we are in fact in a bull trend for the longer-term now.
Daily Time Frame
Next let's look at the daily chart:
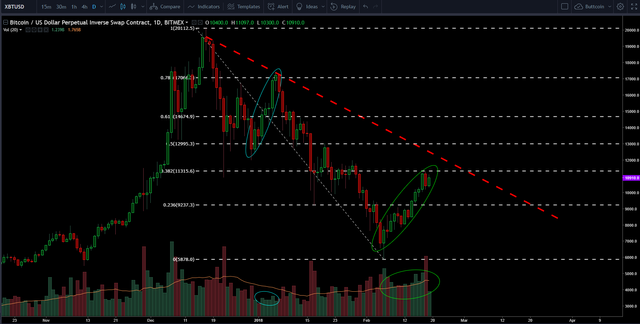
Let's start by talking about the falling red trendline, which I have adjusted for the daily chart. This obviously looks different than the weekly chart did because price is not hitting this trendline on the daily like it was on the weekly. Therefore we still have some time before price hits the trendline to see if it will hold, and then we will continue the downtrend, or if price breaks that trendline and we go up.
Another point of interest for me is that price went up to the 0.382 fibonacci retracement level before falling somewhat and now it is trying to get back to that level. I believe this is another strong resistance area which needs to be broken to really confirm that we are in fact now in a bullish trend.
The two final points of interest for me on the daily chart are the two significant periods of upwards movement after we started going down from the all-time-high of just under $20,000. The first I have highlighted within a blue ellipse. If you look at the volume that corresponds to this movement up, the volume was very weak and therefore it was no surprise that particular up-movement was a bull trap. Now if we look at this current period of upwards movement, highlighted by the green ellipse, the volume associated with it is much, much stronger and so is certainly supportive of a longer-term bullish outlook for BTC vs the USD.
In conclusion for the daily chart, I am waiting for significant price movement above, and closes above, the 0.382 fibonacci retracement level and also of course the downwards sloping trendline. If we can achieve that then I will be much more bullish on Bitcoin vs the US Dollar for the long-term.
One final thing to note if you look at the Daily chart is that BTC/USD (XBT/USD) has more or less been rising and rising since we hit that 5.9k low and we haven't seen a lot of downwards movement during this time. I would therefore say that we might see a fairly significant retracement, maybe to the $9,700 support level or the $9,250 0.236 fibonacci level before Bitcoin rises again and breaks upwards out of that falling trendline to really confirm the new bull trend. So, don't panic if we don't keep going straight up and break them resistance points right away!
Also, as I hope I have illustrated BTC/USD is certainly not a confirmed up-trend yet and so don't be blinded to the possibility that price could stay in this overall bearish trend and not reverse for some time to come. On a personal note I do believe this is the start of a new longer-term up-trend but I am just staying open-minded as you always should!
Thanks for reading guys and your comments and thoughts are always appreciated, let's figure this out together!

Legal Disclaimer: This is just my analysis and not to be taken as professional financial advice. Do your own research beyond what you read in my blog posts and make your own decisions based on your beliefs about what to invest your money in.
It's hard for me to tell, but buying either way
hey. i really really enjoyed this clean analysis. Thanks a lot for your efforts!
great analysis, thanks.
I think we will go up.
Tks for the awareness man. Hope to go up...still on Red here kkkk
I'm bullish on Bitcoin, but, i think we will drop again before going through 12.5k (in my opinion the next resistance level), then who knows! I hope we continue to new ATH, but either way this year is going to be really interesting, for BTC and Altcoins.
Congratulations @investingtips! You have completed some achievement on Steemit and have been rewarded with new badge(s) :
Click on any badge to view your own Board of Honor on SteemitBoard.
For more information about SteemitBoard, click here
If you no longer want to receive notifications, reply to this comment with the word
STOP