How To Plot Support and Resistance Areas
Hey guys, I guess you could say this post is more of a beginner's tutorial. However, I am a believer that even the experts in a field can gain even more knowledge and benefits from going back to basics and strengthening the foundations of their understanding. So, in this post as the title says I will be describing the process I undergo when I am plotting support and resistance on a chart of any financial instrument.
So what is support and resistance in the financial markets? Well, in short, these are areas of price where price stops to "have a breather" and decide where it is going to go next. At support levels (levels below current market price) there tends to be a clump of buy orders because people realize other traders will see this as a support level and will buy there too hoping the price bounces up from there. This is the same but in reverse for resistance levels where there will be a clump of sellers wanting the price to reverse at that resistance area.
One thing to note is that these areas aren't always respected and price CAN blow right through them if the fundamentals behind a financial instrument are strong enough or for some other factor. However, most of the time these levels do have an effect on the price action and therefore the plotting of these levels is a must-do for any investor or trader.
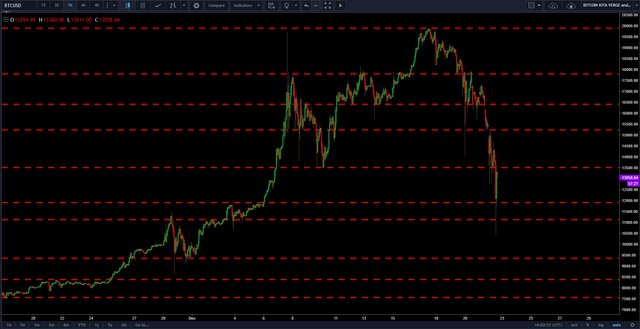
First thing to note is that I like to plot support and resistance levels only on the longer time-frame charts like 4 hourly and above as I believe the shorter-term charts contain too much noise and insignificant twist and turns. So first step is to pull up a blank 4 hour chart like this (BTC/USD (coinbase) in this case):

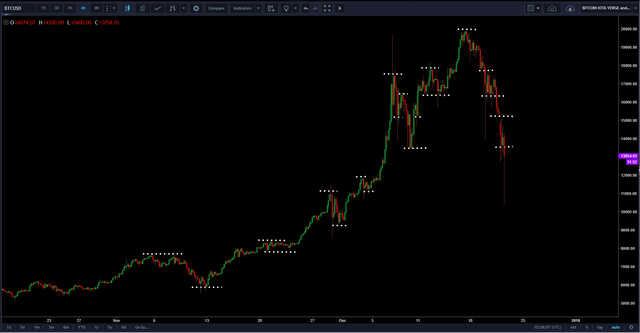
Next, I draw a horizontal line below and above where price goes sideways for a while and either reverses or continues in same direction. These are markers for where you will place your actual support and resistance levels later. This should look like this:
Step three is to simply place a horizontal resistance line at the highest price point and a support line at the lowest price point that you highlight:
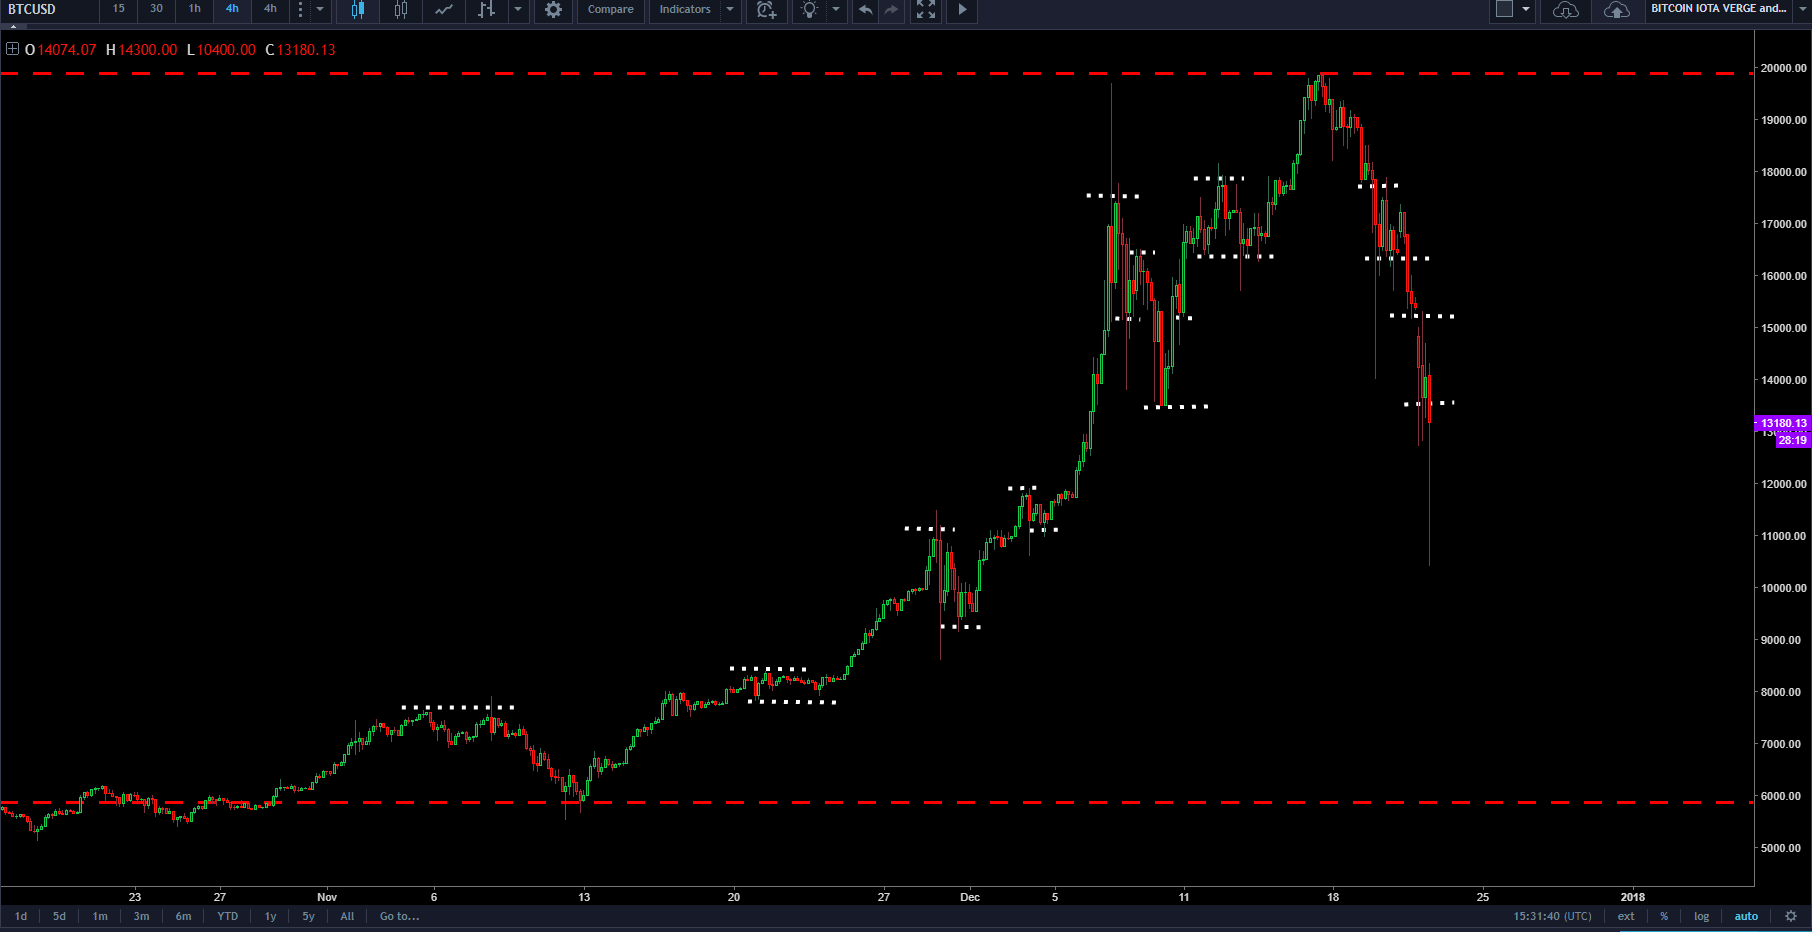
Step 4 is to draw the rest of your support and resistance lines based on the markers you drew earlier and remove the markers:
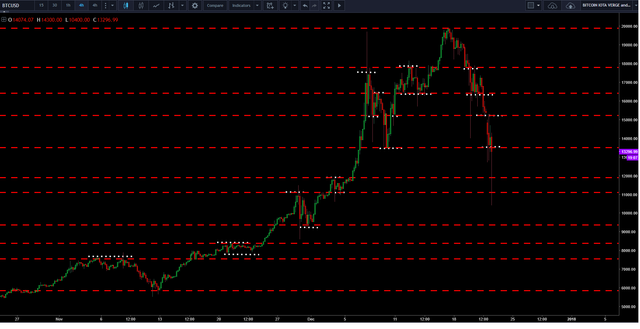
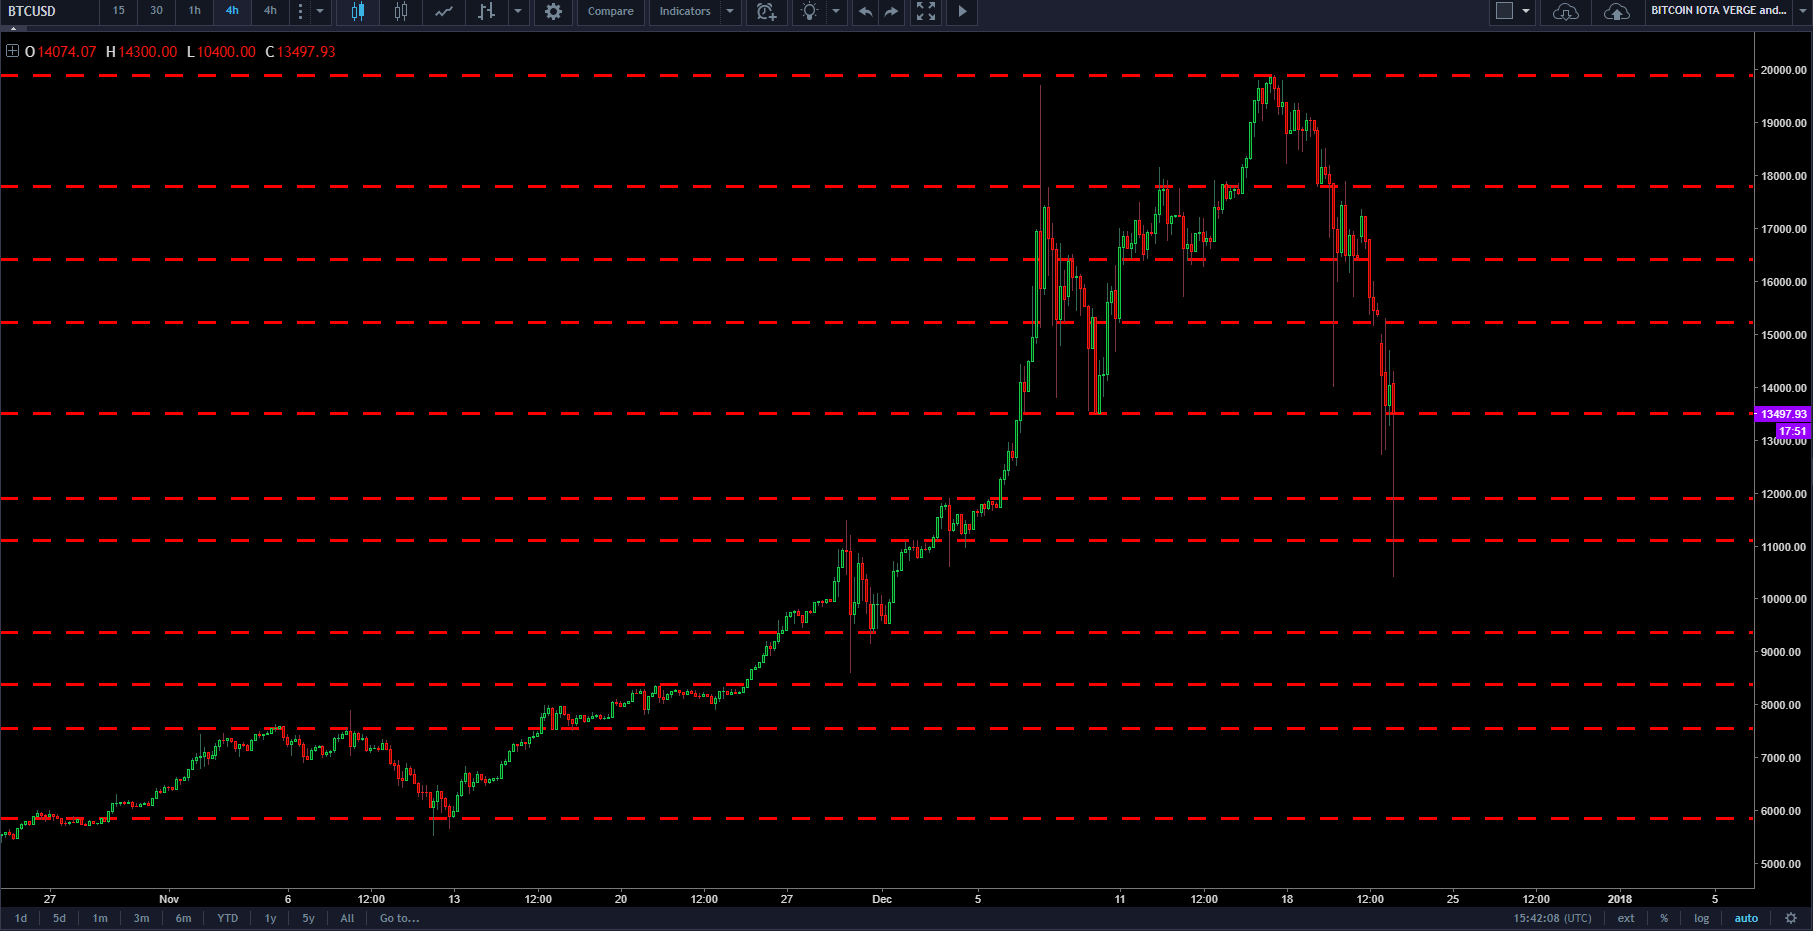
So, now you have drawn your horizontal support and resistance lines, you are ready to move to a slightly shorter term time frame (usually I only go 1 smaller than the time frame I drew my s+r lines on) to watch price action unfold!
Of course, support and resistance isn't enough information to make any decisions on in terms of whether to buy or sell, but they undeniably have an effect on price so they go hand in hand with fundamental analysis, price pattern analysis and volume analysis.
A final tip: don't treat these levels like they are hard and fast rules; if price closes just beyond your resistance line it does not mean that it has definitely broken that resistance area. Price will usually close up through a resistance area and then come back down to re-test that area to make sure it has broken through it. Waiting for this re-test is probably the best way to trade these areas. Patience and a clear-head in the market is a hard skill to master but a must to be profitable long-term.
Thanks for the information, I found it very useful as I myself try to learn more about trading and teach others :)
@originalworks
The @OriginalWorks bot has determined this post by @investingtips to be original material and upvoted it!
To call @OriginalWorks, simply reply to any post with @originalworks or !originalworks in your message!