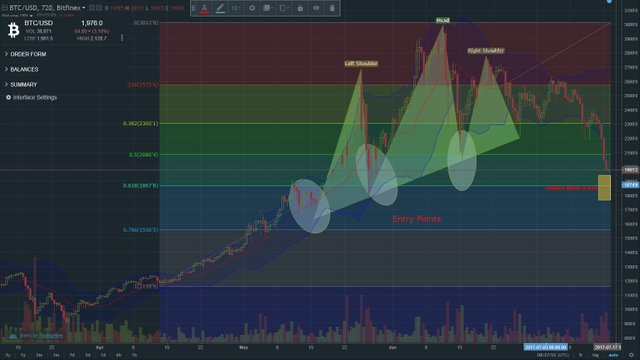
Three Month Technical Analysis Graph of Bitcoin 7/16/2017
I heard that chicks dig graphs, so I made one :-D
Bitcoin has formed a clear "head and shoulders" pattern over the past few months and is now reaching back towards more realistic levels.
Things to note about this graph:
Ellipses mark entry points for investors that may have missed the boat early on
Head and shoulder pinnacles should indicate selling points
Fibonacci Retracement overlaying the background (rainbow colored) suggests that we are approaching the Golden Ratio of 0.618 from Bitcoin's high of ~$3000. This would put Bitcoin back at around $1850 before we see some serious support stepping in.
TLDR version:
Bitcoin will most likely bounce back once it dips into the $1800 range in the short term. Don't be scared and make sure to HODL!!!

I agree. As I pointed out in my opinion post (link below) I believe this will all work out for the best no matter what the out come!
https://steemit.com/bitcoin/@bigdeej/btc-under-usd2k-crypto-fire-sale-in-progress-what-it-going-on