Regular divergence in Bitcoin Daily chart; 2 July 2020
in the D1 Bitcoin chart, you can see a very simple regular divergence between the recent short term downtrend and the MACD oscillator:
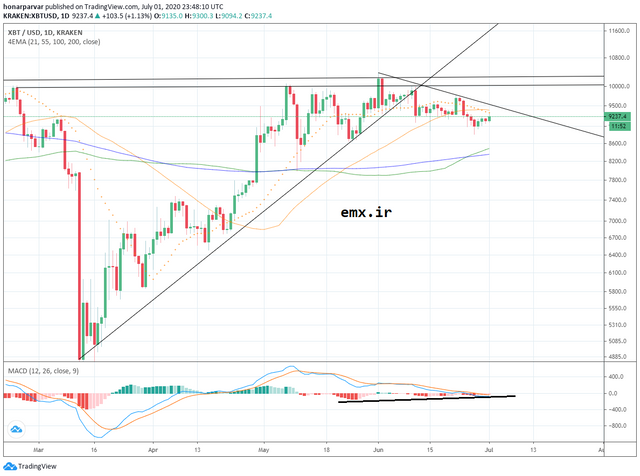
if the divergence is spotted right, the price should try to break the resistance (which is the down trend line) and touch $10k and if there is a good momentum, we will expect further resistances to be tested.
I may republish my posts on my other social media accounts, same username: @honarparvar