Bitcoin Update: We have Five Wave Impulse Down!!!
The @haejin algorithm is now pounding the table even louder than before WARNING THAT NOW IS NOT THE TIME TO BE TAKING BUYING ACTIONS FOR BITCOIN!!!! NOW IS THE TIME TO TAKE SELL ACTIONS!!!!
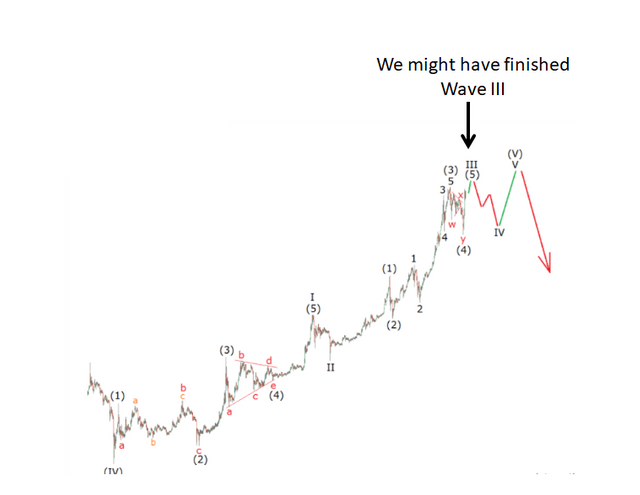
In Elliott Wave Analysis, the first sign of a trend turn is always a five wave impulse against the current trend. The white numbers represent the first potential stage of the major correction towards Wave IV (see long term chart below). As always, an impulse five wave move is followed by a three wave abc (red) correction. I have labeled a and b to be complete and c is almost done. The second confirmation of the start of a major trend reversal is if after c is complete, a vigrous and hard down occurs. It might seem like Bitcoin is dumping itself lower and many are running for the exit. At times gap downs are seen at early stages of trend reversals. Let's see if this happens.

Here is the longer term EW count I've shown before:
If this blog post has entertained or helped you to profit, please follow, upvote, resteem and/or consider buying me a beer:
BTC Wallet - 19gHMJc9wi9KkP47wokz8y4cFNgz1kAAUE
ETH Wallet - 0xf83641dbf1a53498eae6d0d568c969790da48a36
LTC Wallet - LU1mEw1LHvffoWf9VDEVdP7Day4jv6VLqu
EOS Wallet - 0xf83641dbf1a53498eae6d0d568c969790da48a36
Legal Mumbo Jumbo: This is only my opinion, make of it what you wish.
Can I also request your thoughts on ETH? thanks!
Please use only to augment your DD. Here is the ETH update analysis:
https://steemit.com/bitcoin/@haejin/eth-update-primary-and-a-secondary
thanks!!
Thanks for sharing
Very interesting!😃
interesting
It kind of looks like the beginning of an inverted head and shoulders pattern if you ask me...
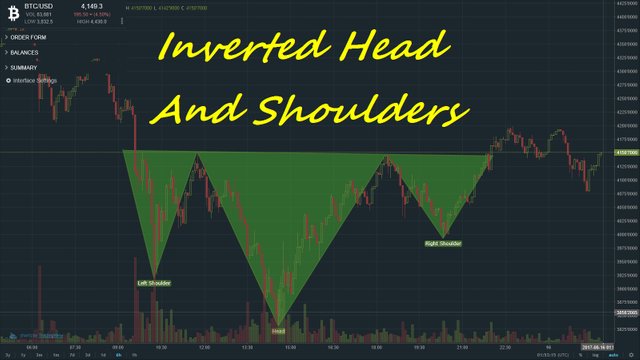
One of the confirmatory requirements of an inverted (bullish) H&S is that they occur in a downtrend. We have been in an uptrend. Also, volume must confirm with LS and RS volumes being less than Head.
What does that one mean?
Inverted H&S is upside down to the one I posted. It's a bullish indication. However, it is best to have it occur on a down trend and that is not the case. Also, I can't tell the time scale of his chart...if it is sub daily and it seems so, then it has little impact to my calls.
In reality, technical charting just is another way to articulate human psychology.
Boom! You got it!
Hi Haejin!
Could you give us your opinion on OmiseGo?
I can't really decide.
The 4 hour chart looks bullish, but I'm thinking that this is just because we've just had some news about Vitalik being in a meeting with the Central Bank of Thailand, plus, at least on Bittrex, there are more sellers than buyers (300k difference) and I see no real volume coming in. So I'm thinking that we will se a bit more of a pullback.
On the other hand the price just broke the downward trend line and we have 20 day MA and 15 day EMA acting as support.
What is your take on all of this?
Thanks for all your posts!
Here is the OMG Update. Please use only to augment your DD.
https://steemit.com/bitcoincryptocurrency/@haejin/omg-oh-my-god-look-at-the-price-go-up