BITCOIN (BTC) Update: Wave IV Projection Mathematics
I wanted to share my thoughts on simple arithmetic derived from a Head & Shoulders Top Bearish Pattern. First, recall the below chart from an earlier post:
I'm going to focus on the area in the green circle. Now peruse the below chart. The Head and Shoulders Top is well in development such that the Left Shoulder (LS) and the Head (H) patterns have been completed. The Right Shoulder (RS) is clearly in progress and should it complete close to the red line pathway, then we need to be concerned about the minimum down draft target.
The arithmetic is simple, but the chart can be hard to understand. Let me take you through it.
- I drew the Neck Line (red slanted) along the bottoms of the LS, H and RS.
- Then I took the price of the lowest point of the Neck Line as denoted in Z (green). Then the highest price point of the Head (H) was marked as ZZ (green). I subtracted: ZZ-Z = $1,648.
- I then identified the highest point of the Neck Line as marked with Q (red). [Note that some take the mid point of Neck Line as Q but I take the highest point.]
- From Q, $1,648 was subtracted to give $2,459 as the Minimum Target.
You might be wondering how in hell all these relate! The answer is from historical data of many, many counts of H&S patterns. Not by me! But as found in this gem of a book below. It's the 10th edition and my personal copy is the Seventh edition from 1997 and it has so many notes and markings but still so very valuable! Yes, this is one of the books I have been recommending.
Let's be patient and allow the price to do what it needs until Wave IV bottom is reached. Until then, raise cash and more dry powder to deploy again.
If this blog post has entertained or helped you to profit, please follow, upvote, resteem and/or consider buying me a beer:
BTC Wallet - 19gHMJc9wi9KkP47wokz8y4cFNgz1kAAUE
ETH Wallet - 0xf83641dbf1a53498eae6d0d568c969790da48a36
LTC Wallet - LU1mEw1LHvffoWf9VDEVdP7Day4jv6VLqu
EOS Wallet - 0xf83641dbf1a53498eae6d0d568c969790da48a36
Legal Mumbo Jumbo: This is only my opinion, make of it what you wish. What does this mean? It means it's not advice nor recommendation to either buy or sell anything! It's only meant for use as informative or entertainment purposes.
There is also a large bearish engulfing candle that just closed on the daily chart.
I believe a bearish engulfing candle needs the red body to overencompass the prior green body.
Nah, that's just small technicality. The important thing is that the engulfing bar is much larger than the previous bar, and that is closes near the lows, which this one has - sort of.
Ehh, I disagree. Thought I'm not an expert in Japanese Candles, it hasn't worked very well for me.
I think it needs to look like this:
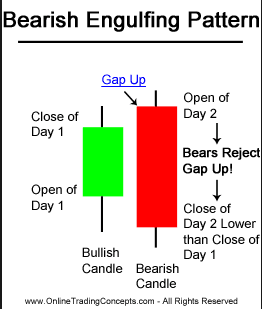
How is this possible in crypto markets that are open 24/7? The upper body edge should align.
Thanks for sharing...
awesome! thanks
This sounds like it could be a good prediction... Seems like we're going down for a little bit. I'm not selling, will hodl during the dippage and bear market. Have long term belief in crypto, and am mostly invested in altcoins anyway.
Absolutely! Hodl will work as after Wave IV, Wave V rise will be next. $7,000 is not unlikely!
I take my strategy from this picture:
🤓
LOL!
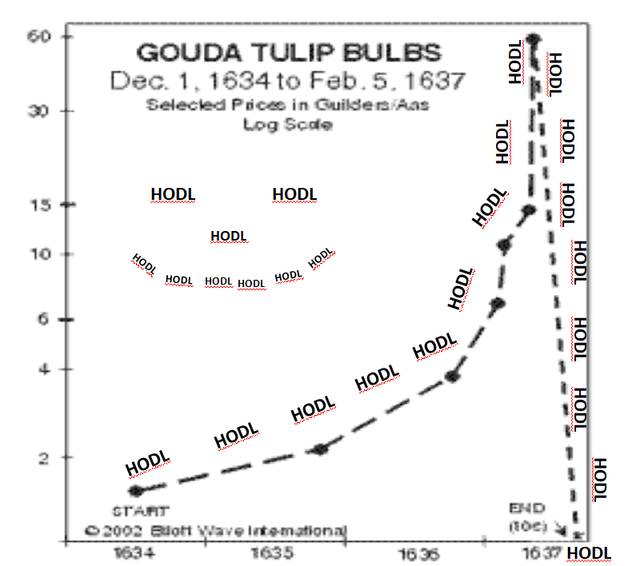
I am still hodling on to my tulips, yes. ONE DAY THEY WILL BE UP!!!
(I am in fact Dutch!)
I loved traveling to Amsterdam. Truly enjoyed the Van Gough museum!
LOL
Thanks for sharing and a clear explanation of where the numbers are coming from. That's why I can't help refreshing your page (min. Of at least 10x/ hour) to see if you have updated charts and TA....
follow on twitter: @haejin_crypto
I send out alerts of new blog posts.
Thanks for the comment!