BITCOIN (BTC) Update: Could the Bottom NOT YET BE IN?????
SUMMARY
Please view the video as it details my thoughts on multiple time scales and counts which are too difficult to put in writing. I believe this video will be most informative in its format.

If this blog post has entertained or helped you to profit, please follow, upvote, resteem and/or consider buying me a beer:
BTC Wallet - 19gHMJc9wi9KkP47wokz8y4cFNgz1kAAUE
ETH Wallet - 0xf83641dbf1a53498eae6d0d568c969790da48a36
LTC Wallet - LU1mEw1LHvffoWf9VDEVdP7Day4jv6VLqu
EOS Wallet - 0xf83641dbf1a53498eae6d0d568c969790da48a36
Legal Mumbo Jumbo: This is only my opinion, make of it what you wish. What does this mean? It means it's not advice nor recommendation to either buy or sell anything! It's only meant for use as informative or entertainment purposes.
Hi mate. Loving your work. Could you take a look at gridcoin please. It seems to be a funny one from a crypto perspective but I know you'll tell me it obeys the same rules as everything else! Many thanks
Please view @haejin s latest bitcoin video, we are now EXTREMELY CLOSE to the danger zone....
UPDATE: The bottom line has officially been breached. Very quick bounce back, but be very cautious, and keep watching.
I've been following the macd all day in addition to these counts, and slowly but surely it is flattening out instead of sharp turn up that it was showing for the daily chart.
flattening out is a bad thing? does that mean it will be showing a bearish trend??
Well it was showing very promising trending toward a strong rise, but has slowed down the momentum upward, which yes, might indicate that prices are not ready to take off upward, but instead might fall. As the video tells, the next 24-48 hours should be watched very very closely. This is quite possibly one of the most essential times to be paying close attention if you are invested.
Here is what I am talking about in visual format.
What you see above is the daily chart showing the MACD in the middle, the momentum on the bottom, and the standard deviation on the top, in reference to the 3 tools below the actual price chart. To view these items correctly, please realize that the deviation is not showing a direction, but instead is showing the deviation from the moving average starting from the baseline of the deviation chart. As you can see, the rises and falls are related to the MACD, but not directly related in the upward and downward sense. Rather, it is indicating to you whether or not the MACD is likely to continue on its current path (where you see the deviation rising and the MACD separating downward). If you saw the deviation falling toward the baseline, that would indicate that the MACD is reaching a steady average (the two lines would be converging...look at the history on the chart and you will see what I mean).
Below your MACD is the momentum, which is generally a good representation of the most current purchasing trend. If you right click and view image, you can zoom in and see how the momentum slowed (it shows earlier than the other two). Along with this, the deviation is starting to flatten where it had been starting to approach the baseline (which would indicated the MACD converging, but here it is indicating a further separation from the average).
Notice on this long term chart, the major profit zones coincide with the MACD crossing up over the average and also above it's baseline (May-July and August -mid September)
That very slight turn downward on the MACD just appeared within the last few hours, while earlier throughout the day it was showing a near parabolic rise up...which has the possibility of over crossing into major profit zones....but it has slowed and is now showing more separation downward.
On the Hour Chart:
You can see very clearly that the short term of all three indicators are pointing toward further separation in a downward direction. This can be viewed as good and bad. The bad being prices will likely fall if this continues (and it may not, you must keep an eye out for quick changes on the short term). The good being you are reading @haejins blog and have the deep knowledge being handed to you for free (which is generally very expensive to get this kind of advice from someone who knows their stuff like @haejin ) - with that knowledge, you may now watch and make an educated decision on your actions...and if it falls and falls, you have time to get out, and then get in at a much lower buy in, and when the MACD makes the rebound, you will be in at a great rate and ride the wave back up into the profit zone and be in the party as bitcoin and altcoins reach their all time highs. Hope this helps to understand.
@scarlet7 thank you for those explanations.
But that was 9 hours ago.
If you don't mind what is the latest?
Haha....yes, just trying to keep those late nighters informed. I've got to get to the office, then I will update that chart if @haejin has not already done his thing!
As of this moment, nothing has changed, we are in crypto purgatory.
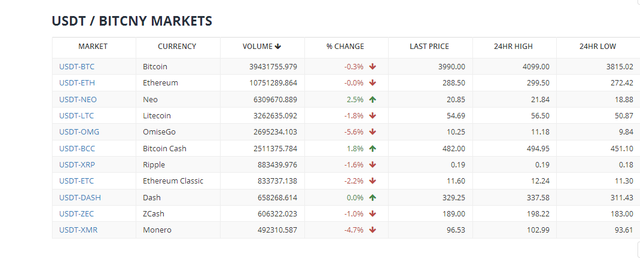
I will add one thing to that, we are not out of the red just yet on most of the big movers:
Thanks.
I'm rooting for more woods.
I got zilch crypto.
NOPE!!! We still got a long way to go....$1,500.
Hmm, interesting. Care to provide details?
The big advantage of being a long term trader.
If BTC keeps heading to the moon, great. However, another pullback and I buy more. Either way I win.
One question, what is the fib of the wave 4 pullback of wave 3 at the cycle level?
Yes! Holding onto the old Turkey is a good strategy and works well. But will you HODL after Wave (V) is hit?
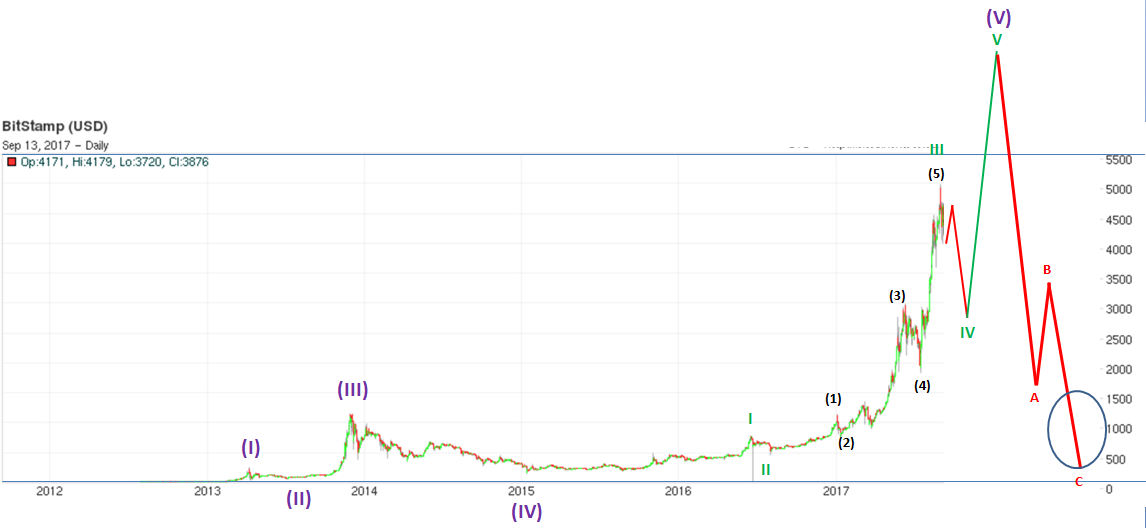
Here is the logarithmic chart. Me? I plan on selling at Wave (V) top as shown in above chart and buying again at bottom of ABC at sub $500.
Yes, even in this, HODL will work. But I expect my number of Bitcoins to be 2000% higher by selling at Wave V and buying back at sub $500. Why? That's when bitcoin goes to $27,000.
Fib was:
0.618 which is why it bounced from $3,045 to current price. I think $2,000 to $2,600 is next
Is bearish your primary count now and most probable aoutxone we drop below $3000 ?uf so will take profits and buy back in ?
I'm 50/50, so neutral for now but still more leaning towards bullish count that I had originally posted.; I have trailing stops on about half of what was bought in the seven rungs.
What is your distance (in USD) from the top when you use trailing stop? It is always dificult for me to figure it out, because I don't want to stopped out to early.
About three days ago, I posted laddering stops. I'm traveling now but will post the link later. Meanwhile, please see if you can locate. It details it all.
I have had an uneasy feeling ALL DAY. I am not a TA but I use my logic and feelings. I don't like the quick run up so fast. I decided take ALL MY PROFITS, IF THERE WERE ANY ,AND WAIT. I HAVE HAD A BAD FEELING ALL DAY. You are the expert..not me...but maybe I made the right decision since I bought in when you said to ladder. Something in the hand is better than nothing....
If I am wrong I can buy in at a higher price....
Sixth sense is sharp!
Sometimes it works if I don't have interference...sometimes it doesn't. I guess it is like Elliot Wave. But with the Wave you have numbers and patterns to predict...I don't know about the word " crash," just a feeling it is going to go down. We will see. Right now Eth and Dash are off there Highs for the day..they seem to predict...
I have had this feeling the entire for eth and btc. I have been trading. I simply don't feel comfortable sleeping on it. Eth increased 100 in 3 days, BTC 1100 in 3 days. I saw tons of penny orders increasing the price. To me it smelled fishy. If you look at order books on gdax no strong book until you go down to 220s and 200s. But some how prices have increased. Some FOMO has taken place. But I saw volume way down but price still increasing few days ago. It just smelled fishy. Today on gdax volume had gone down 10k while price was increasing slowly to 300. Then when hit 300 like 2 mins later I saw 292. I usually FOMO hard but I don;t know I have learned my lesson. I was about to chase 300. I hit canceled each time lol.
Me, too. At least there are 2 of us...
Yes, the volume isn't compelling. Shawnster mentioned that to me as well. Good point.
Upvoted and followed you! Thanks for the information
Thanks for the read, upvote and follow! Much more analysis to come!
@haejin thank you for this. I was confused because other experts were thinking more woods when you posted the bullish videos after the rise back up. It has been very hard for me as I was thorn between bullish and bearish experts.
They talk about other indicators that point to more of downtrend.
But 4 hours ago you answered someone that you are still more bullish.
Although you're travelling, please keep updates coming as we are at a critical point right now. Even a few lines would be enough.
I'm rooting for more woods.
Got my money sitting around and I would love some LTC at 20 dollars and some OMG at 3 dollars maybe.
I'm still 50/50 but slightly towards bullish. Let's see if prices can tackle that blue line resistance!