Long term reversal chart pattern in Bitcoin. Hinting the start of 2018 bull season !
Looking at the BTC/USD chart, I’ve identified a unique long-term pattern. The “Three river bottom”.
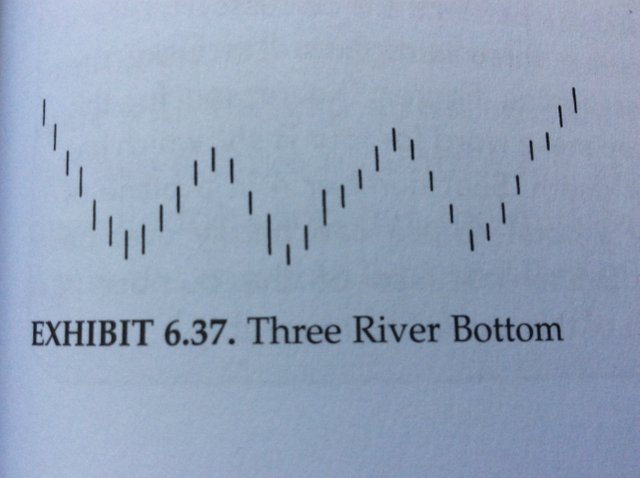
The three river pattern is opposite to the three mountain top. The three river bottom forms over a long period while the market tests the same bottom level “three times”. The Japanese also call this “San Ku” meaning “three gaps”. The third gap often indicates the exhaustion or end of current trend.
As seen on the below chart done by me.
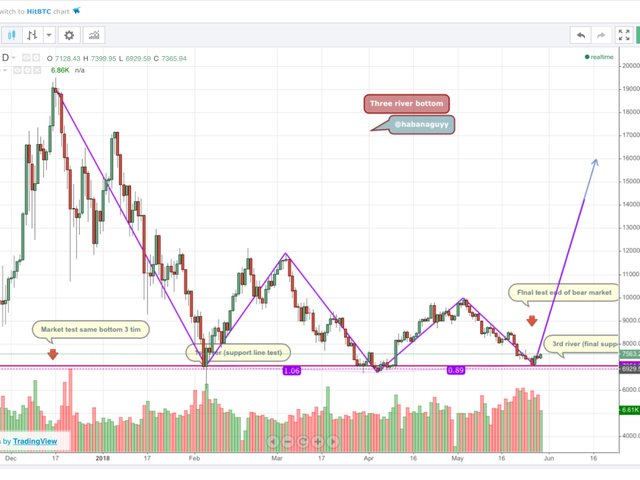
All coincides with past years Bitcoin charts that indicate a market rally to the bulls at the outset of the month of June.
We’re all very excited over here, for this bear market has been a true test to most crypto investors.
I am NOT a financial advisor. This is not financial advice. This is just my opinion and nothing here stated should be taken as financial advise.
Congratulations @habanaguyy! You received a personal award!
You can view your badges on your Steem Board and compare to others on the Steem Ranking
Vote for @Steemitboard as a witness to get one more award and increased upvotes!