7 key charts from Cambridge University 2nd global crypto study
I have reviewed the 96-page report in detail (so you don’t have to) and published a summary of the key findings.
The Cambridge Centre for Alternative Finance published its 2nd global cryptoasset benchmarking study which provides a thorough insight into the crypto ecosystem. I have reviewed the 96-page report in detail (so you don’t have to) and prepared a summary of the key findings. All charts and texts are copied from the report.
MARKET DYNAMICS
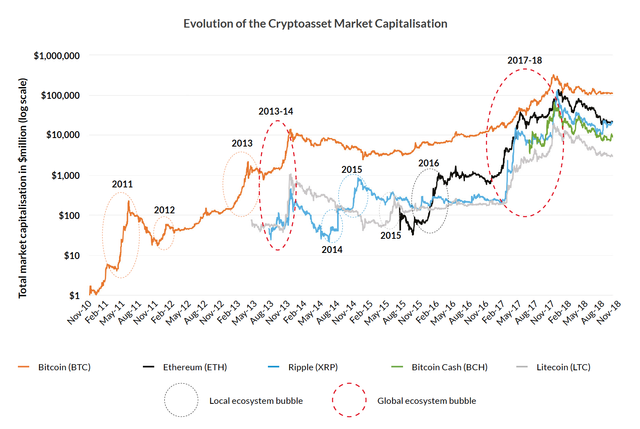
Evolution of the Cryptoasset Market Capitalisation
Crypto markets have seen a succession of local and global ecosystem bubbles since their inception.
Local ecosystem bubbles occur on a regular basis: XRP’s price rapidly increased and collapsed in both 2014 and 2015, whereas ETH saw its market capitalization rise sharply in early 2016 after a successful launch several months before.
The first global ecosystem bubble built up in late 2013 and led to a more than ten-fold increase in the aggregate crypto market capitalization following the announcement that China would allow cryptoasset trading and the time of Mt. Gox trading bots. It began deflating in early 2014 when China rolled back their announcement and Mt. Gox was hacked.
Statements proclaiming the death of the cryptoasset industry have been made after every global ecosystem bubble.
USERS
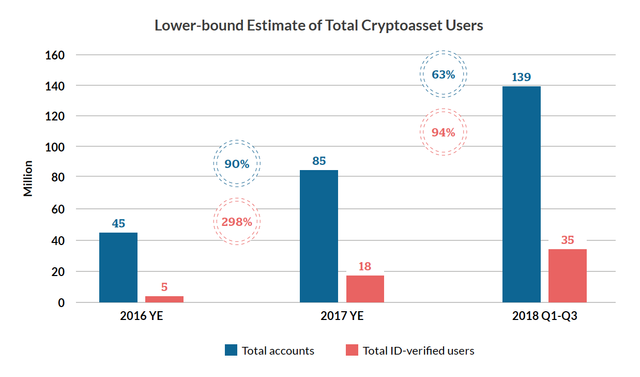
Lower-bound Estimate of Total Cryptoasset Users
Total user accounts at service providers now exceed 139 million with at least 35 million identity-verified users.
Between 2% and 9% of the population of developed countries owned crypto assets as of mid-2018. This extrapolation does not include cryptoasset owners and users from developing countries, whose numbers are likely in the millions as well.
93% of surveyed entities primarily serve hedge funds (on average 60% crypto-focused hedge funds and 40% traditional hedge funds).
The second most commonly served category is merchants (86%), of which on average 63% are online merchants and 37% are brick and mortar merchants.
*A further 35% and 30% of service providers report venture capital firms and other institutional investors as business clients.
EXCHANGES
Reported global exchange volumes frequently amount to US $12 billion a day, with over-the-counter (OTC) volumes estimated by some to be between two and three times larger.
Speculation remains the major cryptoasset use case. Cryptoasset exchanges offer a median amount of leverage of 3.3x.
5% of surveyed cryptoasset-only service providers hold a license, compared to 39% of fiat-supporting entities.
Some fiat-supporting entities have to close up to 85% of accounts (or refuse new account openings) following KYC/AML checks.
CUSTODY
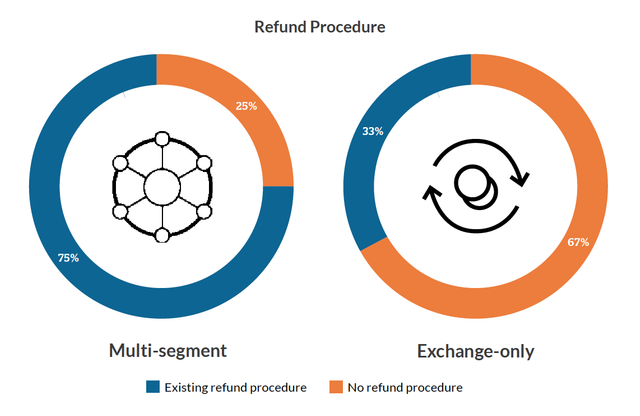
Refund Procedure
Two-thirds of specialized custodial exchanges do not have a refund procedure in the case of customer funds getting lost or stolen.
76% of custodial service providers report conducting an externally-led audit of their cryptoasset reserves in the past 12 months, which stands in stark contrast with the relative minority of non-custodians who did so (35%).
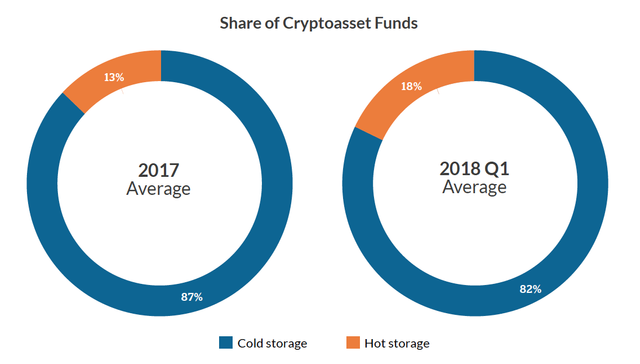
Share of Cryptoasset Funds
- The share of funds held in cold storage has slightly decreased over 2017. From 2017 to 2018 Q1, the figure for exchange-only providers has decreased by 8 percentage points, which is likely a result of intensified trading activities that require exchanges to have immediate access to cryptoasset funds.
MINING — ENERGY CONSUMPTION
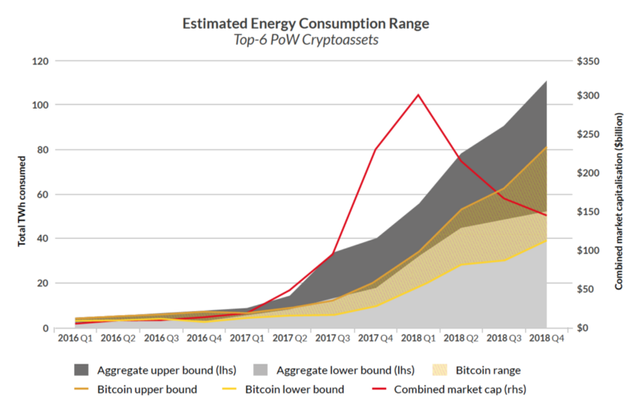
Estimated Energy Consumption Range (Top-6 PoW Cryptoassets)
The combined energy consumption of the top-6 coins has consistently grown despite the recent downturn in market capitalization.
The top-6 crypto assets collectively consume between 52 and 111 TWh of electricity per year. This figure amounts to less than 0.01% of the world’s total annual energy production.
Total energy consumption increased more than fivefold between mid-2017 and mid-November 2018.
Bitcoin alone accounts on average for 75% of the total energy consumption.
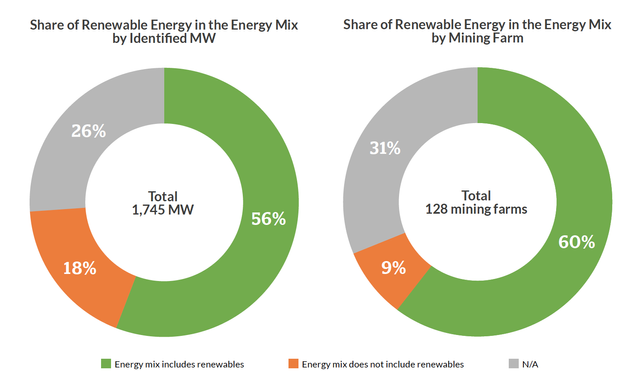
Share of Renewable Energy in the Energy Mix
More than half of hashing facilities run on an energy mix that contains a share of renewables.
Identified facilities draw on average 28% of their energy requirements from renewables.
MINING — HASHING
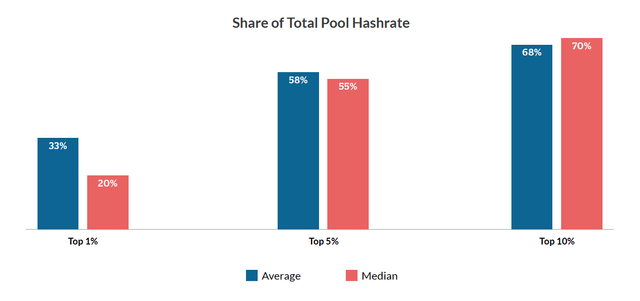
Share of Total Pool Hashrate
One third of the pool’s total hashrate is provided by the top-1% of contributors, whereas 10% of active pool members contribute 68%.
Cryptoasset hashing has become more geographically distributed since 2017, particularly with China losing relative “market share” to some North American and Scandinavian regions.
More than a third of surveyed pools are fully controlled by a single person.
Only four pools combined control more than 50% of Bitcoin’s total hashrate. The picture looks even more concentrated for other cryptoassets: it would only take three pools to collude in order to perform a 51%-attack on Bitcoin Cash, Ethereum, Litecoin, and the Monero network; whereas two ZCash pools alone control more than half of the network’s hashrate.
These charts show the tremendous growth of the crypto ecosystem in 2018 and as I wrote in my latest monthly crypto commentary, 2018 was the most active year for crypto in its history.
If you find value in this article, please share it with the community.
Share your thoughts in our Telegram Group and help us ignite an active discussion within the crypto community.
Follow me on Steemit to get notified about all my future posts. I also regularly share my thoughts on everything crypto related on social media. You can find me on Twitter,LinkedIn, Instagram and Facebook.
Thank you so much for sharing this amazing post with us!
Have you heard about Partiko? It’s a really convenient mobile app for Steem! With Partiko, you can easily see what’s going on in the Steem community, make posts and comments (no beneficiary cut forever!), and always stayed connected with your followers via push notification!
Partiko also rewards you with Partiko Points (3000 Partiko Point bonus when you first use it!), and Partiko Points can be converted into Steem tokens. You can earn Partiko Points easily by making posts and comments using Partiko.
We also noticed that your Steem Power is low. We will be very happy to delegate 15 Steem Power to you once you have made a post using Partiko! With more Steem Power, you can make more posts and comments, and earn more rewards!
If that all sounds interesting, you can:
Thank you so much for reading this message!