Bitcoin bullish divergence and inverse H&S?!?!?
https://www.tradingview.com/x/JypmGw8D/
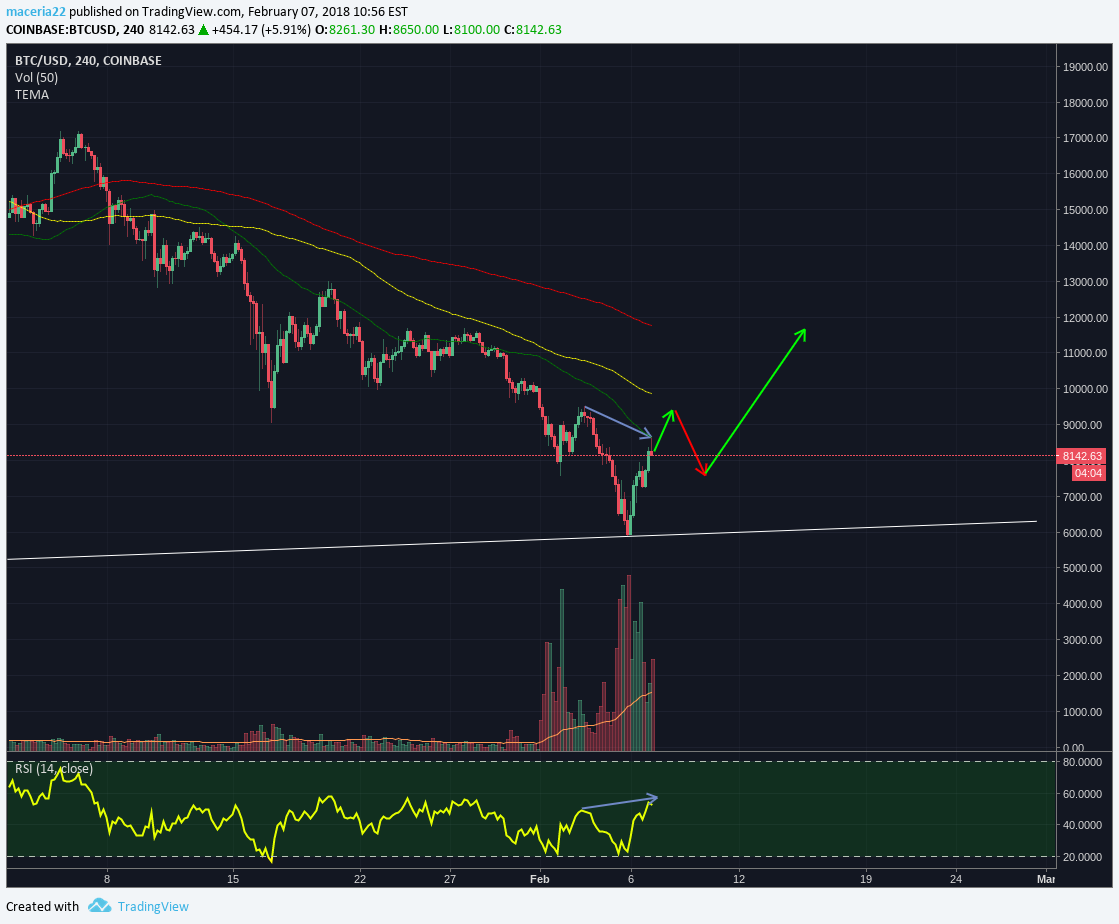
DID WE HIT OUR LOW POINT!?!?!?
I've noticed a bullish divergence on the Bitcoin charts using RSI and the 4hr candlesticks. A bullish divergence indicates upward price movement. In the above graph we seemed to bounce off the 50MA (Green Line) but I believe we are expected to continue the upward trend closer to $9,000+ in the coming day or so. The chart above shows a possible inverse head and shoulders pattern in formation. I'm predicting a short retrace back to the $8,000 after our move to $9k then back up to the sub $11k for mid term.
I enjoy sharing my my thoughts and opinions and hope that my technical analysis will help you profit. We are all in this together!!!! If this information helped you, kindly share upvote and resteem!
Donations are appreciated! Thank you.
BTS (Bitshares) address: Gooloo22
BTC address: 1FCyxyTvTmYy2RbZ5ctBUETxzBB1ycBE6R
ETH address: 0x974734F3e6A0654781a903321cEbd5617E97D968
LTC address: LctpgAEzLVKNhg5Lh6aomUc9KXeLKgeF5m
Disclaimer: This is not financial advice. Please trade at your own risk.
Nice observation man.. i think atleast for now we shouldn't past the head it may retest but the divergence is a nice sign of reversal especially as it's a higher time frame.
I agree. I spot H&S patterns often but I do tend to get ahead of myself on occasion. The divergence is a great trade signal as I see it giving me some great profits since I began trading. Thanks for the comment!