Bitcoin (BTC) Price: Bullish Pattern Confirmation!!
Bitcoin Price Key Highlights
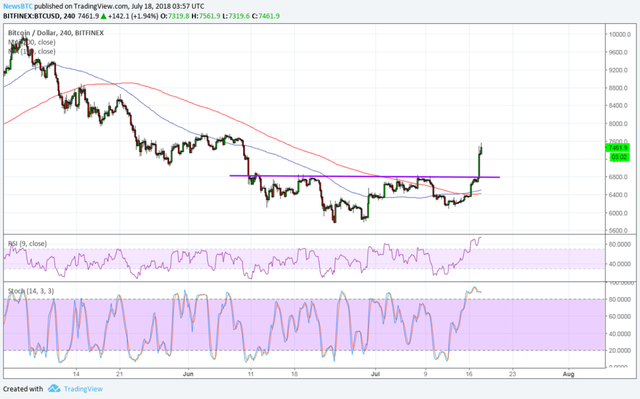
Bitcoin price finally broke above the neckline of its inverse head and shoulders pattern to signal that a rally is underway.
The chart pattern is around $1,000 tall so the uptrend has room to go, but a pullback might take place.
Technical indicators are showing mixed signals while sentiment favors more bitcoin price gains.
Bitcoin price made a strong upside break from the neckline of its inverse head and shoulders pattern.
Technical Indicators Signals
The 100 SMA just crossed above the longer-term 200 SMA to indicate that the path of least resistance is to the upside. This confirms that the reversal is more likely to gain traction than to retreat.
The chart pattern spans $5,800 to $6,800 so the resulting uptrend could be of the same size. This could be enough to take bitcoin price to $7,800 so it’s not too late to join the rally. However, stochastic is already indicating overbought conditions so there may be some profit-taking here.
Once the oscillator heads south, bitcoin price might follow suit and retest the broken neckline before resuming the climb. Stochastic is also in overbought territory to indicate that buyers are exhausted and that sellers might take over.

Congratulations @gobalconnect! You received a personal award!
You can view your badges on your Steem Board and compare to others on the Steem Ranking
Vote for @Steemitboard as a witness to get one more award and increased upvotes!