Chart analysis for Gold, BTC & Steem - Monday Nov 6th, 2017 @ 3pm PST
Hello all, here are my notes regarding the charts for Gold, BTC and Steem from this afternoon.

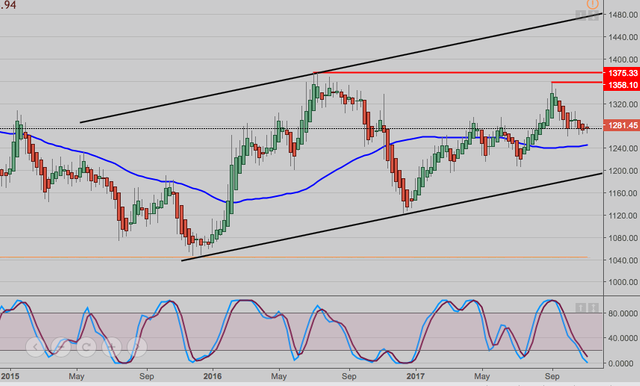
Here is a weekly chart of Gold going back to 2015 with a Heiken Ashi overlay on the candlesticks indicating the trend and a 50 dma. To remain in the uptrend within the upwards trend lines, Gold should take out the previous top of $1358 and then $1375. The stochastic are under 20 and in the oversold area, we may see a turn around in the coming week...?
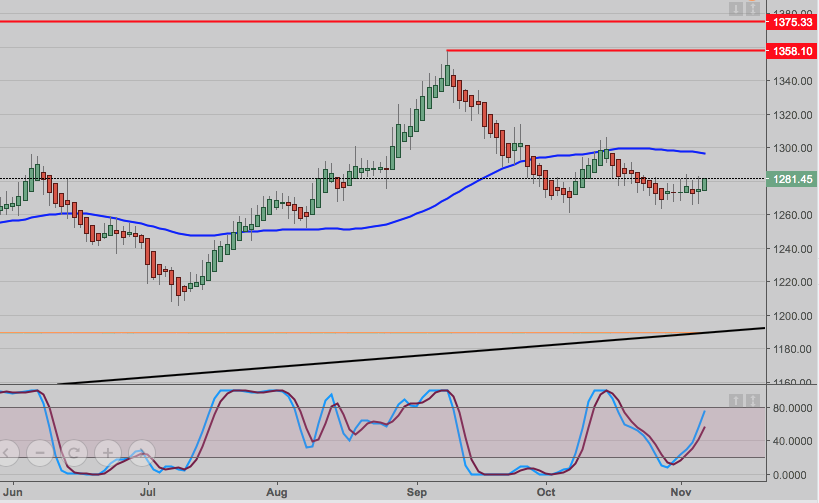
The daily Gold chart just printed a green bar which may suggest the start of a uptrend. The stochastic are climbing and will most likely reach the overbought (>80) area in a few days. December is next month and the Fed may raise interest rates which will probably impact the US Dollar and the precious metals market.
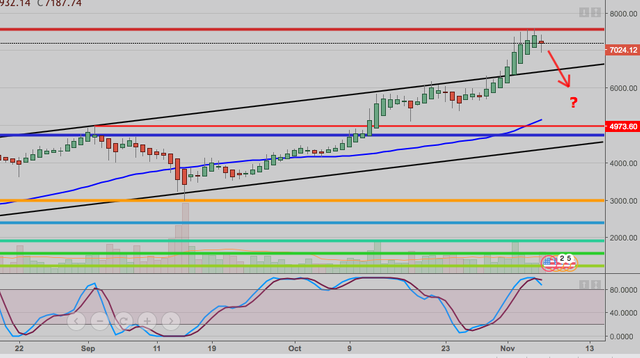
The previous BTC analysis provided the next potential high and possible turn around point. This was done using the Fibonacci re-tracement/projection tool. BTC pretty much hit the 2.618 projected Fib level of $7574 (Top red line) and has started a small pullback.
Will it continue? Maybe... The K stochastic has crossed over the D line and looks like it may start moving lower. Potential support areas are the 50 dma and the previous major high of $4973. (Lower red line on the chart)
*Segwit2x will be on Nov ~16th and may impact price. I've read some speculation that people will sell the Segwit2x coin and purchase BTC.
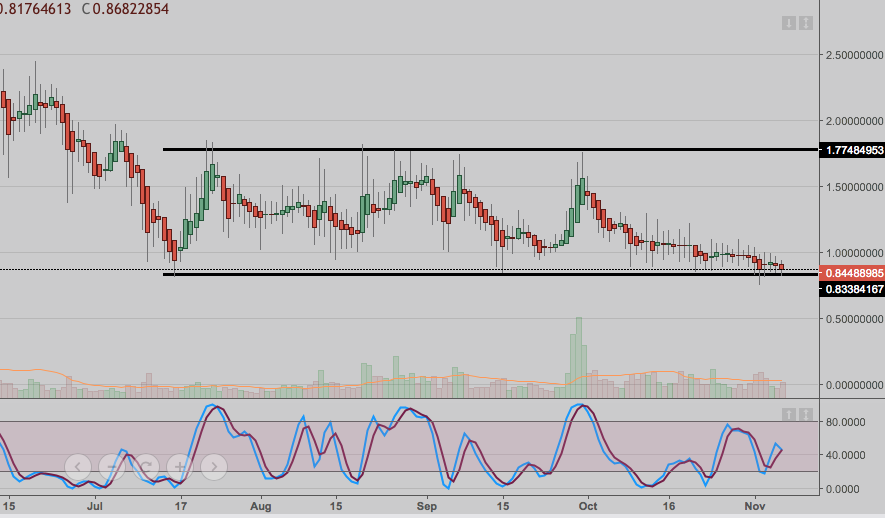
Here is the daily chart of Steem/USD from Bittrex. Guess there is not too much to see or say here... It is at the bottom of the consolidation channel and does not seem to be getting any interest at all. As stated in the earlier post, we just need to wait and see what happens to Steem post Segwit2x.
Nothing in this post is investment or trading advice.
Happy Monday! =)