BTC chart review, August 15th @ 19:30 PST

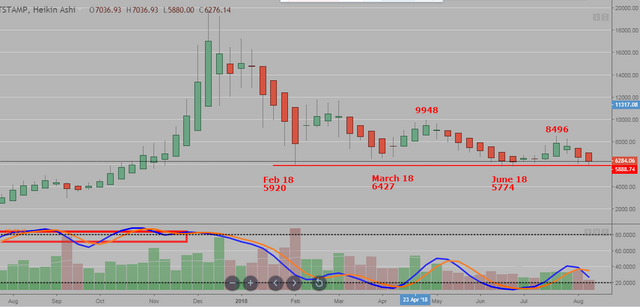
Here is the long term monthly chart of Bitcoin from the Bitstamp exchange. The heikin ashi bars are still in the red illustrating the downtrend.
There is nothing bullish about this chart, all bears for now.
One observation is that the last 2 bars are shorter in length and if the bars continue to get shorter, it may signal a potential turn around in price.

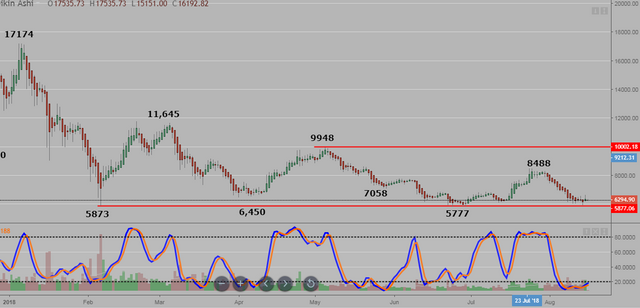
The weekly chart has the major highs and lows indicated and price is currently near the bottom of the range. (Or support)
It has printed 2 red heikin ashi bars and stochastics have rolled over to the downside. Nothing bullish here either...
The daily chart is from Coinbase which also indicates the recent highs and lows.
For BTC to transition back to a bull market, it needs to print above 8488, then the next major high of 9948.
Stochastics are embedded to the downside, but may be ready to break out and above the oversold level of 20....?
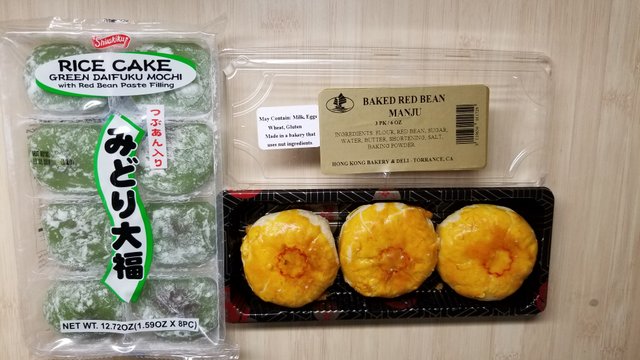
While it does not look too good for the crypto markets lately, just hodL on and don't pay too much attention or thought if your long.
Sit back and have some dessert like I did the other day. This is Manju/Mochi which is a Japanese dessert with a sweet red bean paste on the inside and either a rice or pastry exterior. They are good with both coffee and green tea!
Good information provided.
Good analysis. Nice chart and graphically shown
You got a 7.76% upvote from @upme thanks to @glennolua! Send at least 3 SBD or 3 STEEM to get upvote for next round. Delegate STEEM POWER and start earning 100% daily payouts ( no commission ).