MicroStrategy sees more gains after halving following 150% rally
As reported by Yahoo Finance, according to analyst BTIG MicroStrategy Inc.'s 150% jump. – driven by large bets on Bitcoin has the scope to increase further as crypto prices rise.
Analyst Andrew Harte raised his price target to $1,800 on Friday, implying the stock could rise at least another 10% from recent trading.
On the other hand, according to Contelegraph, trading volume on the Binance exchange hit a yearly high at $1.12T in March. According to an April 5 report by cryptocurrency analytics platform CCData, Binance's spot trading volume increased by 121% to $1.12 trillion in March
The report said the combined market share of the exchange also increased by 1.04% to 44.1% in March. The surge in trading volume through these exchanges reflects increasing investor interest in digital assets.
Meanwhile, the combined spot and derivatives trading volume on centralized exchanges (CEX) also rose 92.9% to a new all-time high of $9.12 trillion in March.
Bitcoin technical analysis today
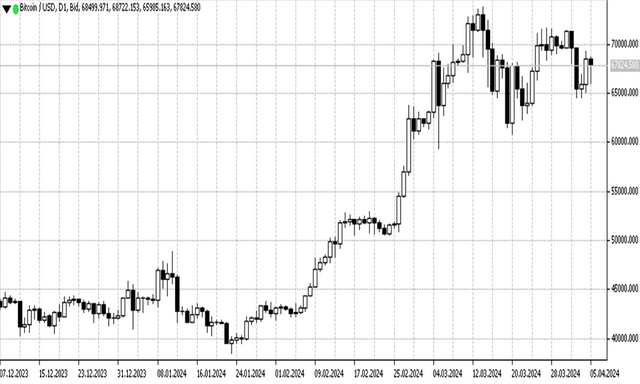
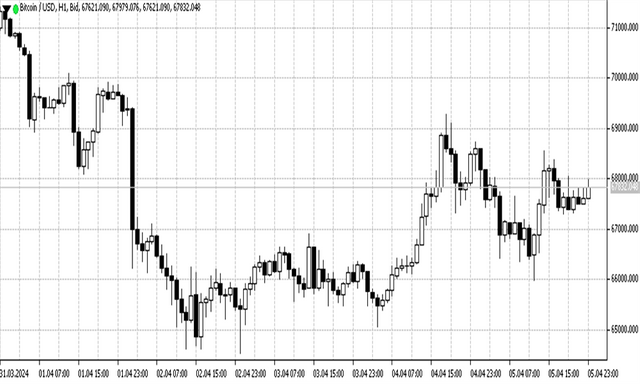
Today Bitcoin is trading at $67,893.72, down 0.81% in 24 hours. The daily 24-hour price range is at a low of 66,023.3 and a high of 68,692.2.
Bitcoin's market cap is above $1.3 trillion with a 24-hour volume of more than $33 billion according to Coinmarketcap data.
The total supply of Bitcoin on the market is 19,674,268 BTC out of 21 million BTC.
The summary of technical indicators and several moving averages by Investing for the hourly time period today gives a strong buy signal.
Bitcoin price is moving in consolidation near the middle band line at around $67k on Ticktrader. Flat and narrow Bollinger bands indicate a sideways market and less volatility.
Meanwhile, the RSI indicator shows level 52, meaning the price is slightly above the uptrend level.
On H1 timeframe the price also moves near the middle band line, here the Bollinger band forms a flat channel with a slightly narrowed band indicating a sideways market with less volatility.
The RSI indicator shows level 56, meaning the price is moving above the uptrend level.
Support and resistance
S3: 67191.4
S2: 67361.6
S1: 67492.6
PP: 67662.7
S1: 67793.7
S2: 67963.8
S3: 68094.8


