Interest in Bitcoin futures rises amid BTC price consolidation
According to Bitcoin.com combined interest in Bitcoin futures rose to a new all-time peak of $37.55 billion. Of this amount, $11.5 billion of this amount came from CME Group, positioning it as the leading derivatives trading platform when it comes to BTC futures. Second is Binance with an OI of $8.22 billion, Bybit with $5.29 billion, Bitget with $3.82 billion, and Okx with $3.13 billion. Deribit and Bingx have OIs ranging from $1.74 billion to $2.63 billion each.
Positive news may affect the value of Bitcoin in the long term, although currently, the Bitcoin price in this week's trading tends to be stuck at the $70k level.
Bitcoin/USD technical analysis
Bitcoin is down 1.33% today trading at $69922 at the time of writing with a total gain in the last 7 days at 10.18%.
The Fear and Greed index shows a value of 82, which means the market has extreme greed for crypto assets. The interest of large institutions can still be seen from the value of this index.
Bitcoin/USD traded within a range of Low $69,076.65 and High $70,913.10 in the last 24 hours.
The summary of some technical indicators and some moving averages by Investing Today gives a Buy signal with Buy values: 13 Neutral: 3 and Sell: 4.
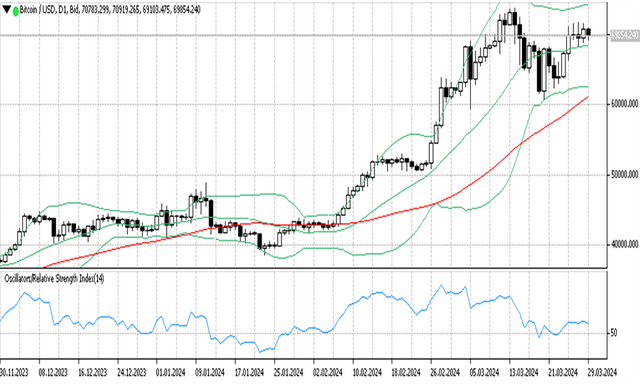
On Ticktrader FXOpen the price appears to move between the upper and lower band lines. Prices forming small-body bearish candles reflecting prices tend to have less volatility.
The structure of the Bollinger band indicator in the daily timeframe shows a sideways market with a flat line and the distance between the upper and lower bands appears to be narrowing.
MA 50 is still forming an ascending channel below the lower band, this may be dynamic support for bullish Bitcoin movements.
The RSI indicator shows level 56, meaning the price is above the uptrend level.
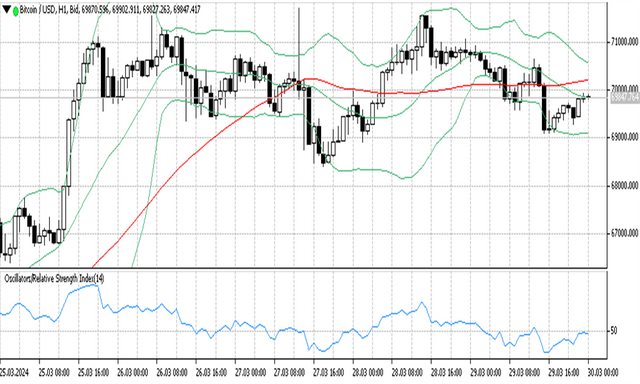
On H1 timeframe. The price is now moving near the middle band line, this is the pivot point area based on the Bollinger band indicator. A breakout from the downside may bring the price up to reach the upper band line.
Here the Bollinger band forms a slight downward channel with a narrow band indicating less market volatility.
The RSI indicator at level 48 reflects that the price is below the downtrend level.
Support and resistance
S3: 69175.9
S2: 69303.7
S1: 69559.4
PP: 69687.3
R1: 69943
R2: 70070.9
R3: 70326.5

