Bitcoin Spot ETF trading volume tripled in March to $111 billion, but Bitcoin dropped to $65k
Cointelegraph reported that Bitcoin Spot ETF trading volume tripled in March to $111 billion. This was nearly three times the trading volume recorded in February, as Grayscale and BlackRock ETFs dominated the market.
According to Bloomberg ETF analyst Eric Balchunas, Bitcoin ETF spot trading volume reached $111 billion in March, compared to $42.2 billion recorded in February.
However, today's Bitcoin price is seen dropping at the $65k level. The market may still be waiting for the Bitcoin halving for future Bitcoin value projections. The $70k level still appears to be solid resistance for several weeks of trading.
Bitcoin/USD technical analysis today
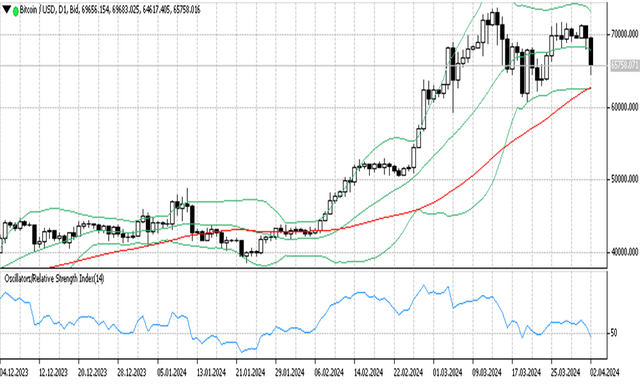
Bitcoin price at the time of writing at $65,686.5 dropped 5.75%. Bitcoin price fell again from a high of $69683 in yesterday's trading.
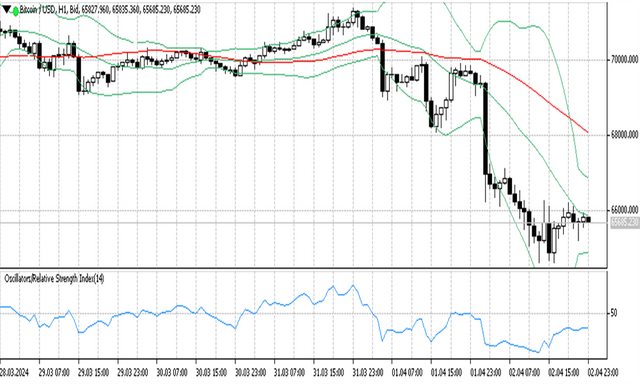
According to a summary of technical indicators and several moving averages, they provide Sell signals on an hourly basis today.
Bitcoin price seems to be still having difficulty breaking the $71k level and several times the price reached this zone the price turned down. Today's decline was recorded at more than 5%.
On Ticktrader FXOpen, Bitcoin price formed a bearish candlestick with a long body and a small shadow at the bottom of the candle, an indication that the downtrend is fading somewhat.
On the daily timeframe the Bitcoin price is between the middle and lower band lines. Here the Bollinger band line forms a flat channel with a slightly narrowed band indicating slightly reduced volatility.
MA 50, which measures the trend in the past 50 days, forms an upward channel in line with the lower band.
The RSI indicator that measures overbought and oversold zone prices shows a value of 47, meaning the price is below the downtrend level.
On the H1 timeframe, the price is near the middle band line. This is a consolidation zone after Bitcoin's strong decline yesterday. At this point, the bearish trend begins to fade. Bollinger bands are narrowing, indicating reduced volatility.
MA 50 is far above the upper band line forming a descending channel indicative of a market downtrend.
The RSI indicator shows level 37, meaning the price is moving below the downtrend level zone.
Support and resistance
S3: 65311.2
S2: 65447.1
S1: 65631.4
PP: 65767.3
R1: 65951.6
R2: 66087.5
R3: 66271.8


